Comprehensive Data Analysis Project
تفاصيل العمل
This project involved a comprehensive data analysis with the goal of transforming raw data into actionable insights to support decision-making. The project utilized a precise statistical analysis methodology to ensure reliable and in-depth results.
Key Project Steps and Core Findings
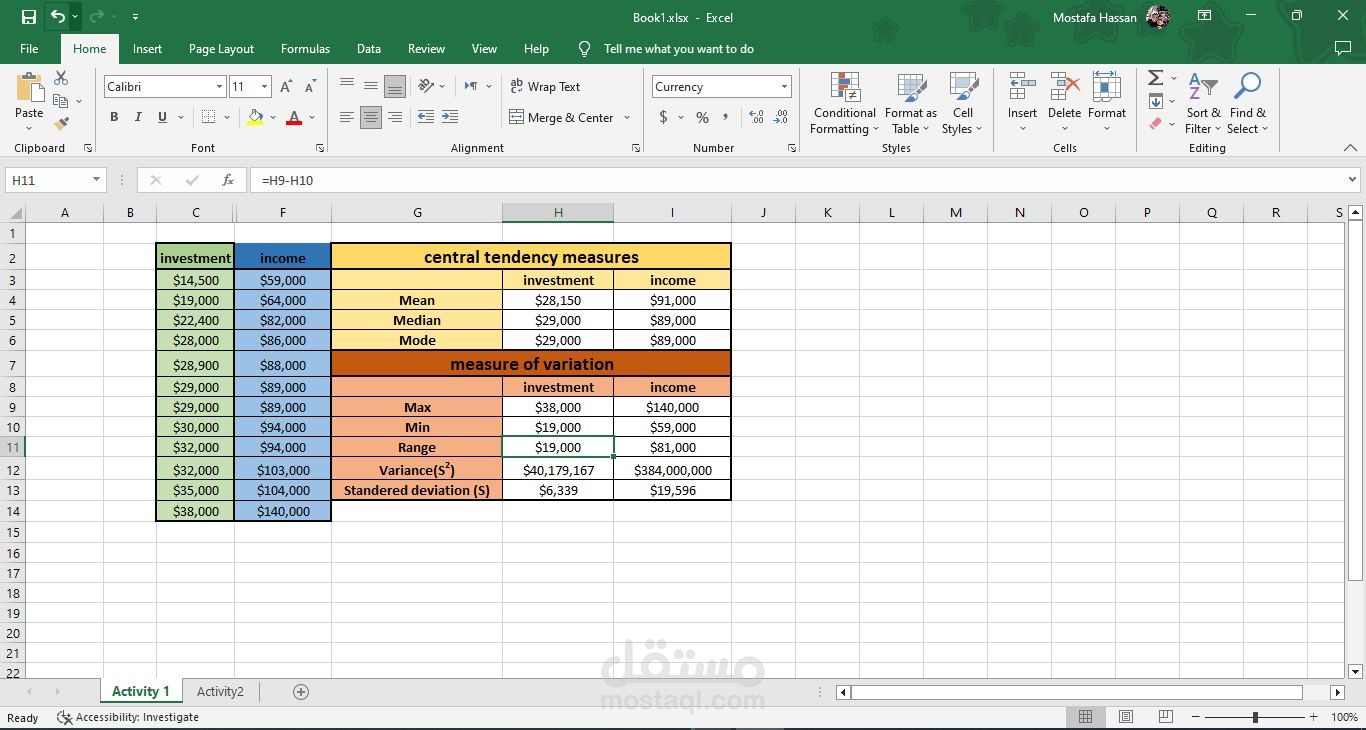
Analysis of Central Tendency and Variation Measures:
Central Tendency Measures were calculated to understand the typical value within each dataset (Investment and Income):
Mean: To determine the average value of the datasets.
Median: To find the middle value that divides the data into two equal halves.
Mode: To identify the most frequently occurring value.
Measures of Variation were calculated to understand the spread of the data:
Range: To determine the difference between the highest and lowest values.
Variance and Standard Deviation: To quantify the dispersion of the data points around the mean, reflecting the volatility.
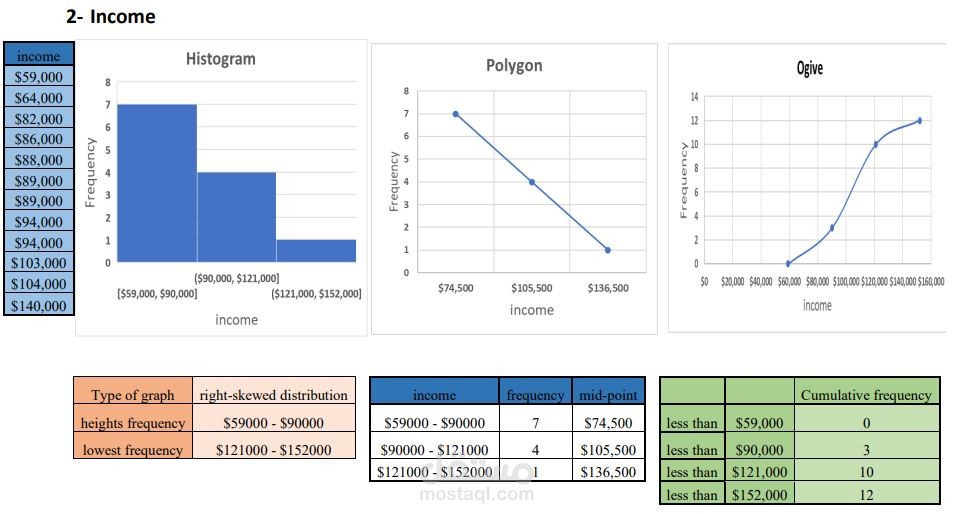
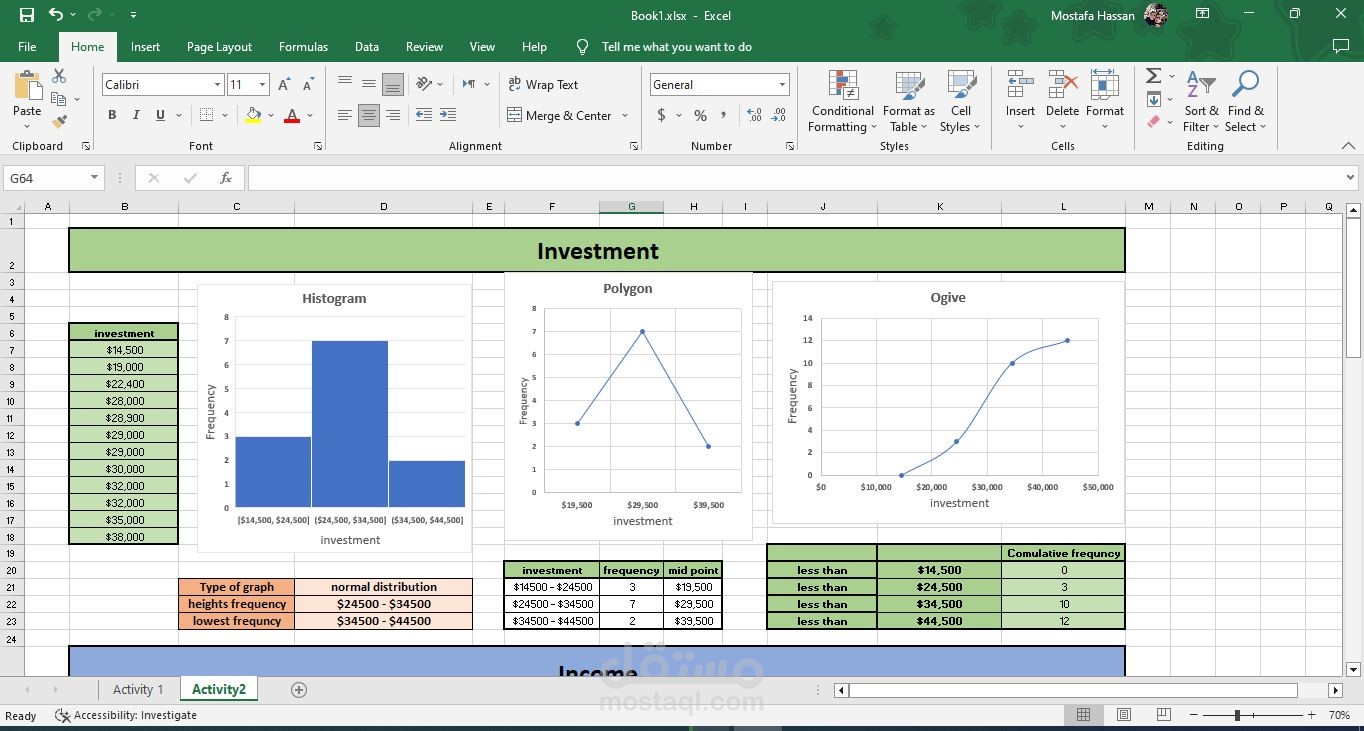
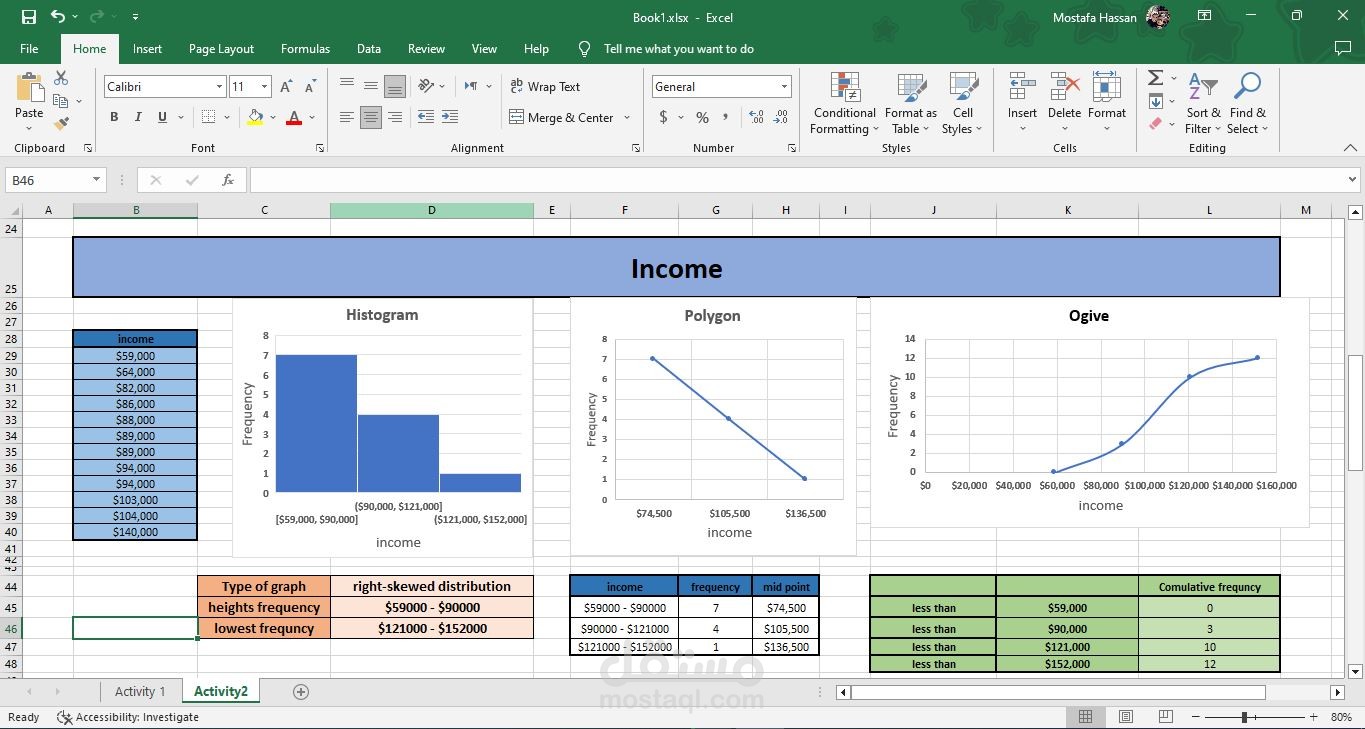
Statistical Graphical Representation:
Histogram: Created to visualize the data distribution and show the frequency of each class. This analysis helped identify the shape of the distribution, such as the right-skewed distribution for the income dataset, which indicates the presence of a few high values.
Polygon Chart: Developed to visually represent the frequency distribution by connecting the midpoints of the class intervals, providing a clear view of how frequencies change.
Ogive Chart: Generated to display the cumulative frequency distribution, making it easy to determine the number of observations that fall below a certain value.
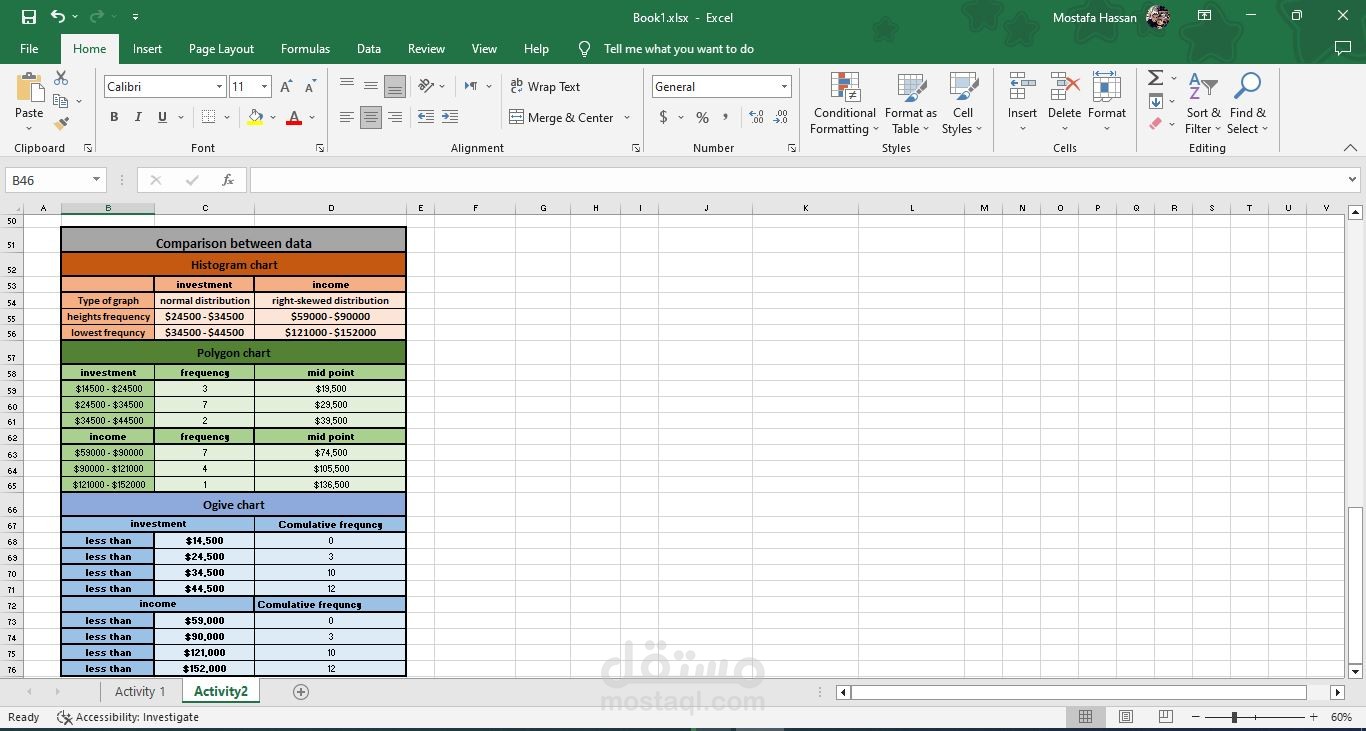
Data Analysis and Comparison:
In-depth comparisons were conducted between the different datasets based on the statistical results.
The nature of each dataset's distribution was analyzed, revealing that the income distribution was right-skewed.
A simple dashboard was created to consolidate the charts and statistical data, making it easier to understand relationships and patterns between variables.
Final Report:
A comprehensive final report was prepared, summarizing all findings and interpreting the statistical significance of the data.
Recommendations based on these insights were provided to help users or management make informed strategic decisions.
This description effectively showcases your skills in using data analysis tools and applying statistical concepts to extract real value from data, which are essential skills for a professional data analyst.