Telecom Customers Churn Analysis using EXCEL
تفاصيل العمل
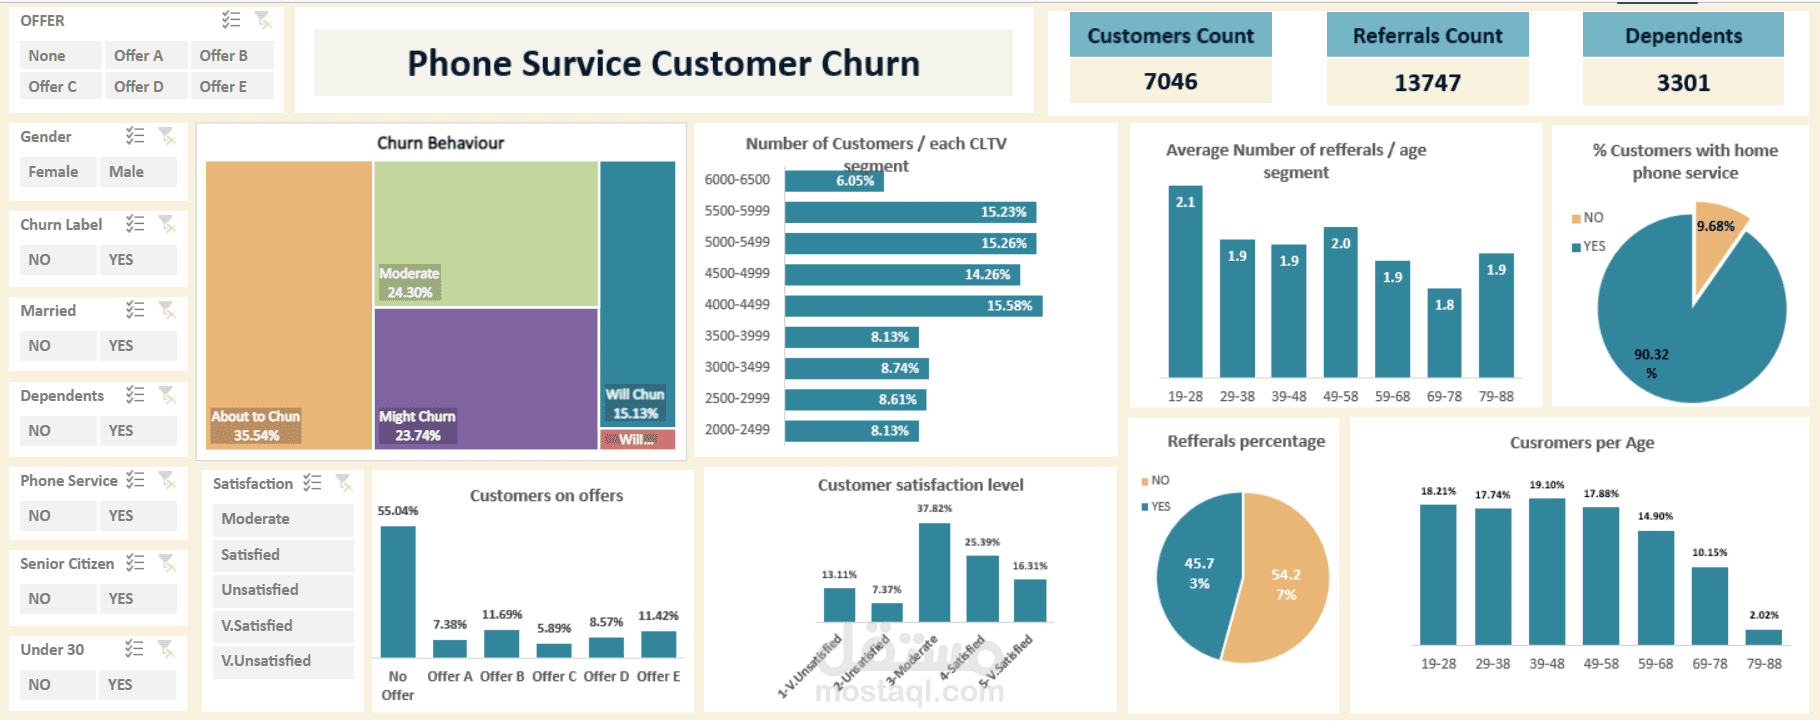
A complete Data Analysis & Visualization Project using MS Excel!
The purpose of the project is to study the churn of the users from the company. Explore the patterns, the purposes, and the customer's behavior such as, when customers tend to churn. what is the most significant factor that makes customer churn? and what is the pattern of customer churn?
?I perceived that project following these steps:
- EDA or Exploratory Data Analysis, to get to know the data and understand the business better.
- Data Validation
- Data Cleaning and Preprocessing
- Data Manipulation and Feature Engineering
- Getting insights out of the data
- Correlation to know the most significant factors on customer churn.
- Creating a DASHBOARD
You can find the whole steps of the project and details here
You also can check the DASHBOARD HERE