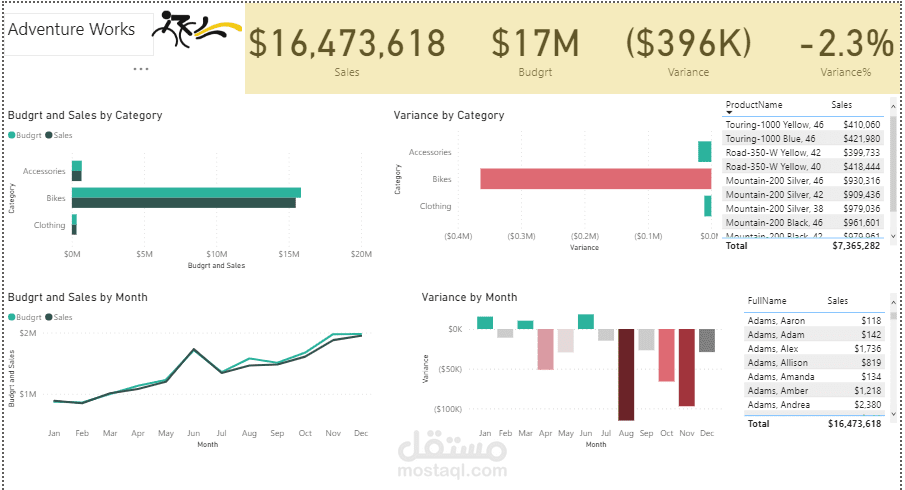
Data analysis with Excel and Power BI
تفاصيل العمل
"Our data analysis project involves working with large sets of data from multiple sources to uncover key insights and trends. To achieve this, we will be using a combination of Excel and Power BI.
First, we will start by importing the data into Excel, where we will clean and organize the data to make it more manageable for analysis. We will use Excel's powerful functions and features to transform the data and create reports that highlight key findings and trends.
Once we have analyzed and processed the data in Excel, we will then move on to Power BI. Power BI is a powerful data visualization tool that allows us to create interactive dashboards, reports, and visualizations that bring the data to life. We will use Power BI to create compelling visuals that communicate our insights in an easy-to-understand format.
Throughout the project, we will work collaboratively with you to ensure that our analysis meets your specific needs and requirements. We will also provide detailed documentation of our methodology and findings, so you can use the insights we uncover to inform your business decisions."
