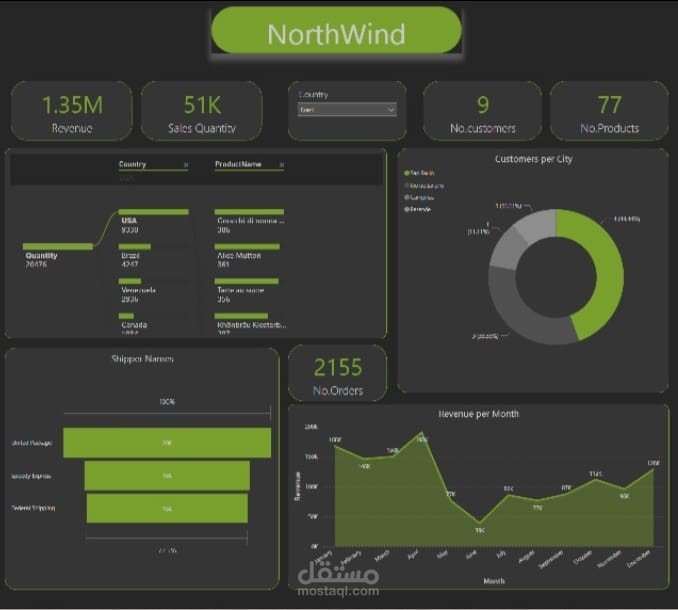
Northwind Sales shipping
تفاصيل العمل
We created this Dashboard using the data from API Northwind API
First, we extracted data by Power BI. Then, we made some Cleansing and Transformation
Finally, we load the data so we could apply some DAX and create the Dashboard.
This cycle called ETL.
