S&P 500 Stock Analysis Dashboard
تفاصيل العمل

‘ S&P 500 Stock Market ‘ aims to:
- Analyze and report the daily data of S&P 500 Index Stock Market and its Companies and Sectors
- Help in drawing insights and represent the Most Important KPIs to the investors
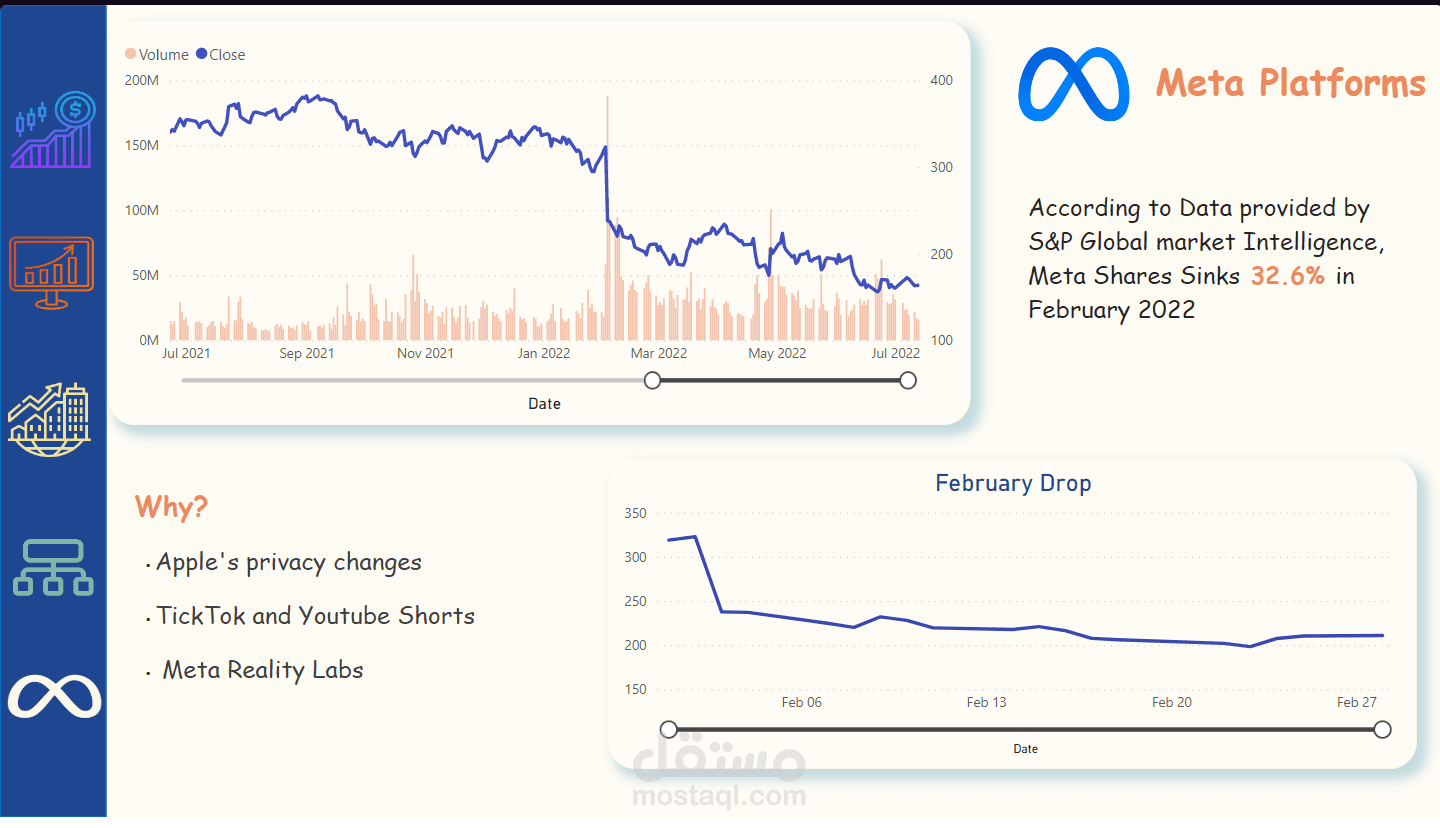
- Case Study about Meta Platform
Our Dashboard represents data :
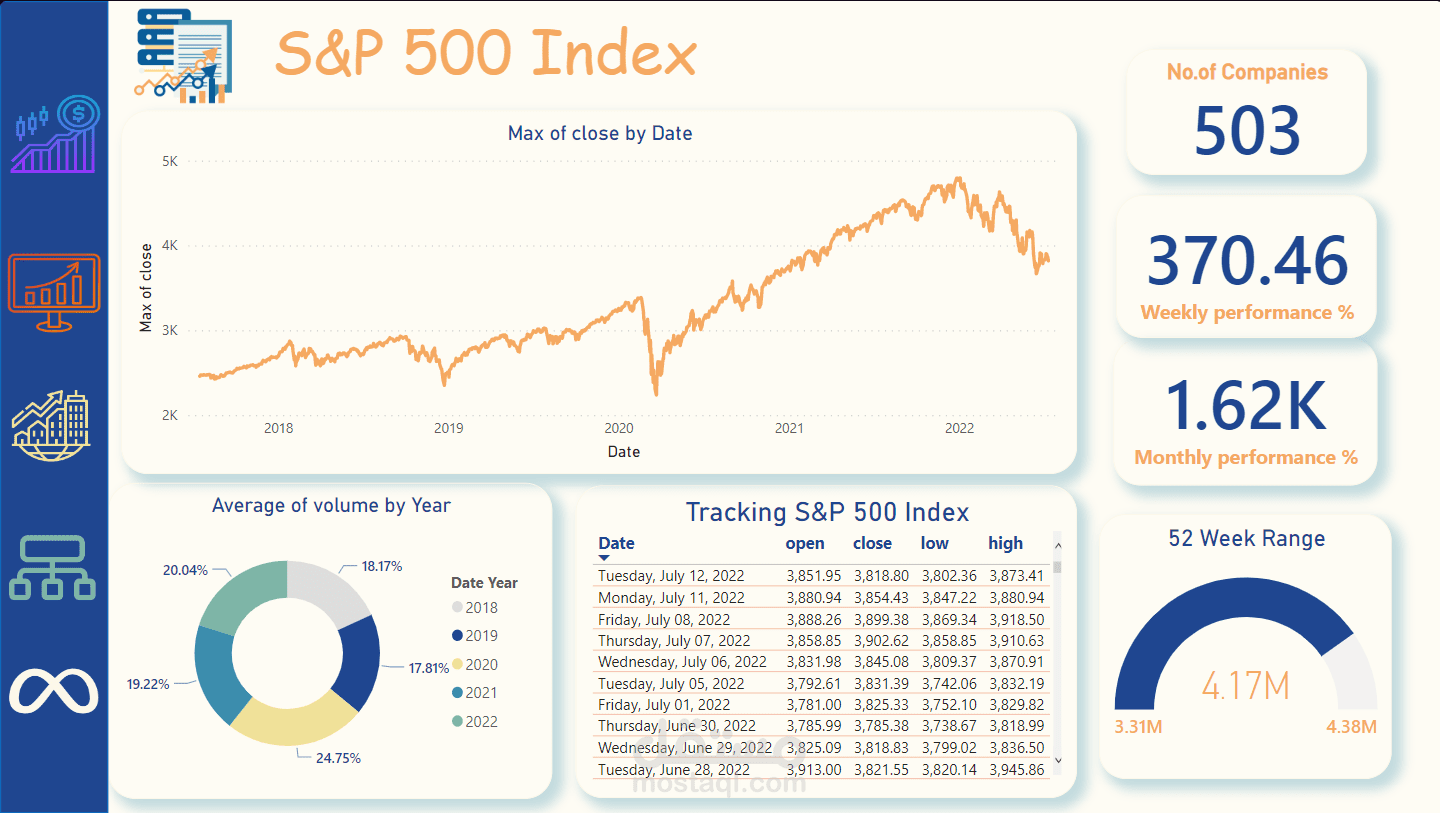
- Daily Monitoring of The S&P 500 index stock market and general information.
- Tracking stock of the top companies based on some KPIs and Reporting the Top and the lowest Performers
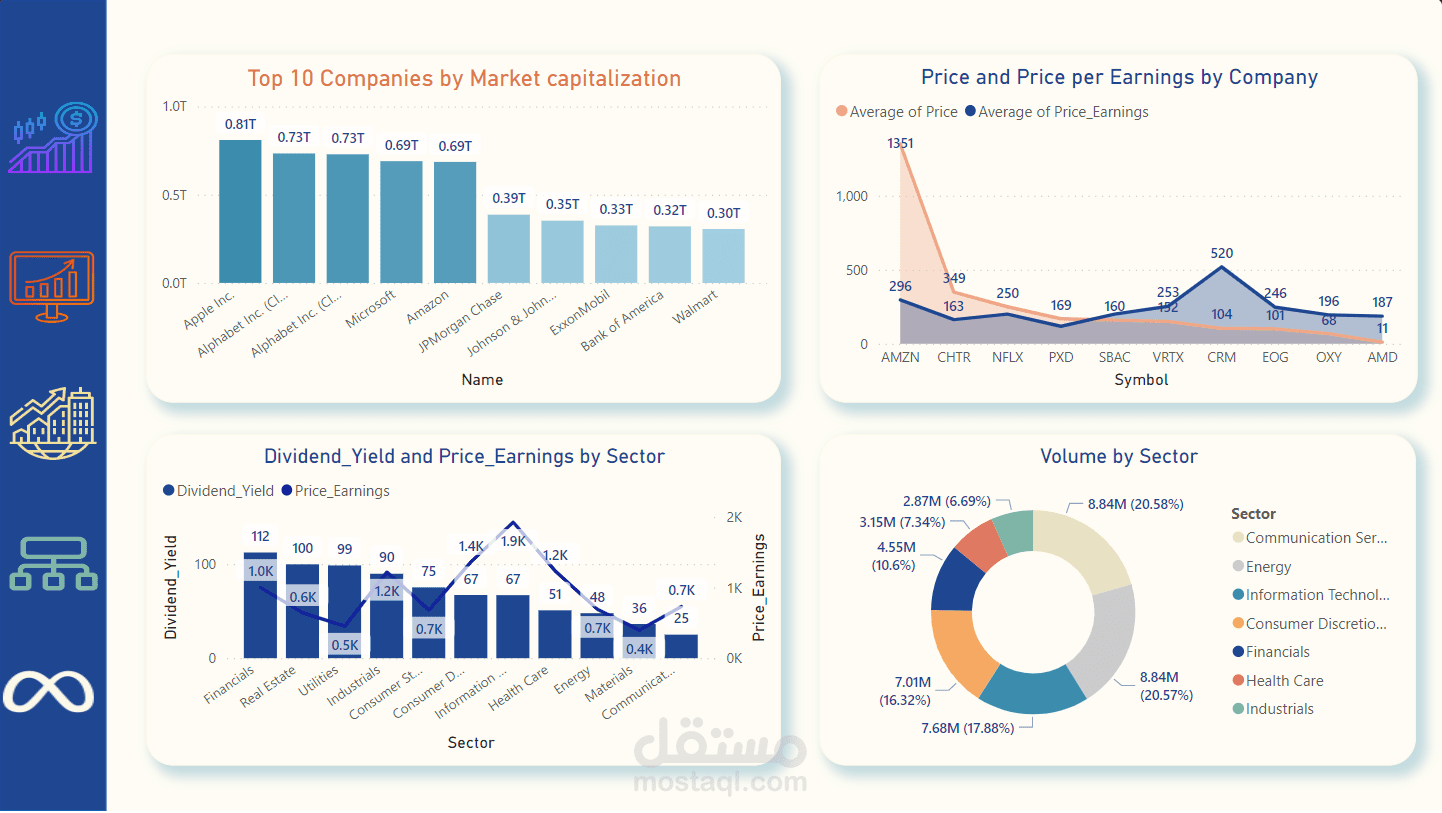
- Representing Stock Investing Metrics for each Company and its Industry.
- Representing Sectors Comparisons based on some KPIs
- Meta Platform Case study and the reasons behind its drop
And Here are the Milestones we went through:
- Collecting Data from Different Resources kaggle, Yahoo Finance and Wikipedia
- Cleaning, Analysing and Exploring Data using Excel and Python
- Data Modelling using Galaxy Schema in Sql Server Management Studio
- Analytical SQL Queries
- Microsoft Power BI
Link for Interactive Dashboard in novyPro: