عمل لوحة تحكم (dashboard) لعرض مبيعات المطاعم في الولايات المتحدة الأمريكية - Make dashboard to display restaurant sales in the USA
تفاصيل العمل
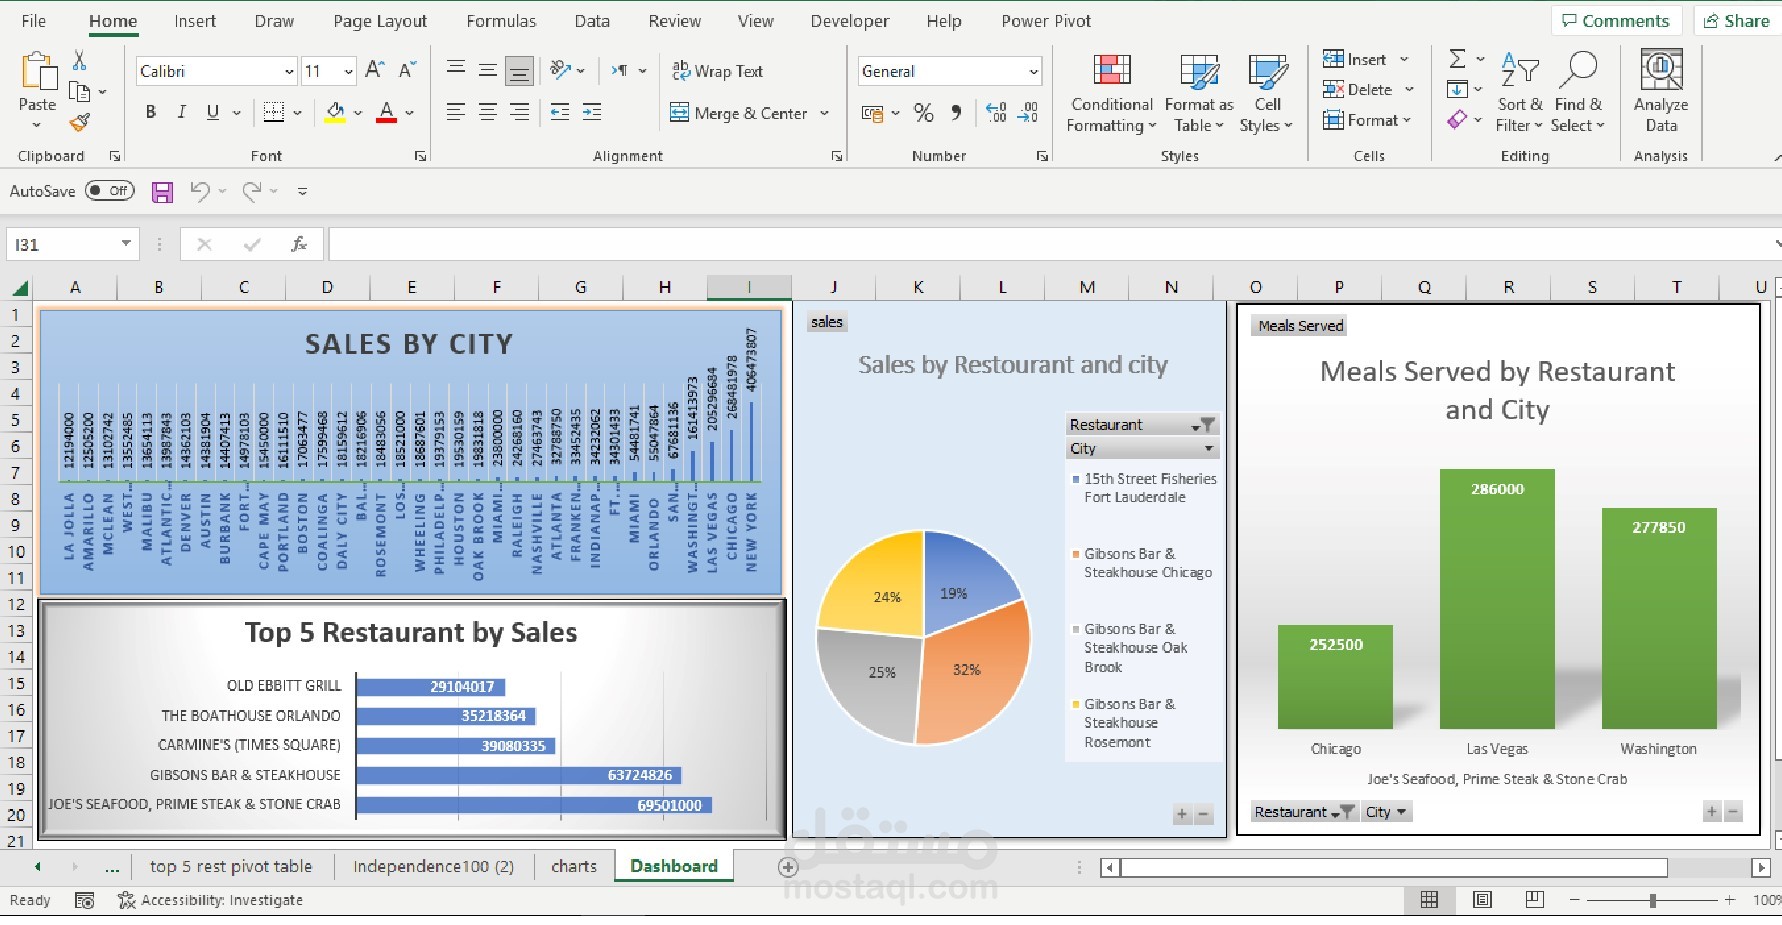

عمل لوحة تحكم (dashboard) لعرض مبيعات المطاعم :
1- تم عمل جدول محوري (Pivot Table) .
2 - تم عمل رسم بياني يوضح مبيعات كل مدينة .
3 - تم عمل مخطط بياني لتوضيح أعلى 5 مدن من حيث المبيعات .
4 - تم عمل مخطط بياني (Pie chart) لتوضيح المبيعات من حيث المطعم والمدينة .
5 تم عمل رسم بياني يوضح عدد الوجبات المقدمة من حيث المطعم و المدينة .
Make a dashboard to display restaurant sales
. Pivot Table has been made
. A graph has been made showing the sales of each city
. A chart has been made to illustrate the top 5 cities in terms of sales
. Pie chart has been made to clarify sales in terms of restaurant and city
.A graph has been made showing the number of meals served in terms of the restaurant and the city