Revenue Performance Dashboard – Excel
تفاصيل العمل
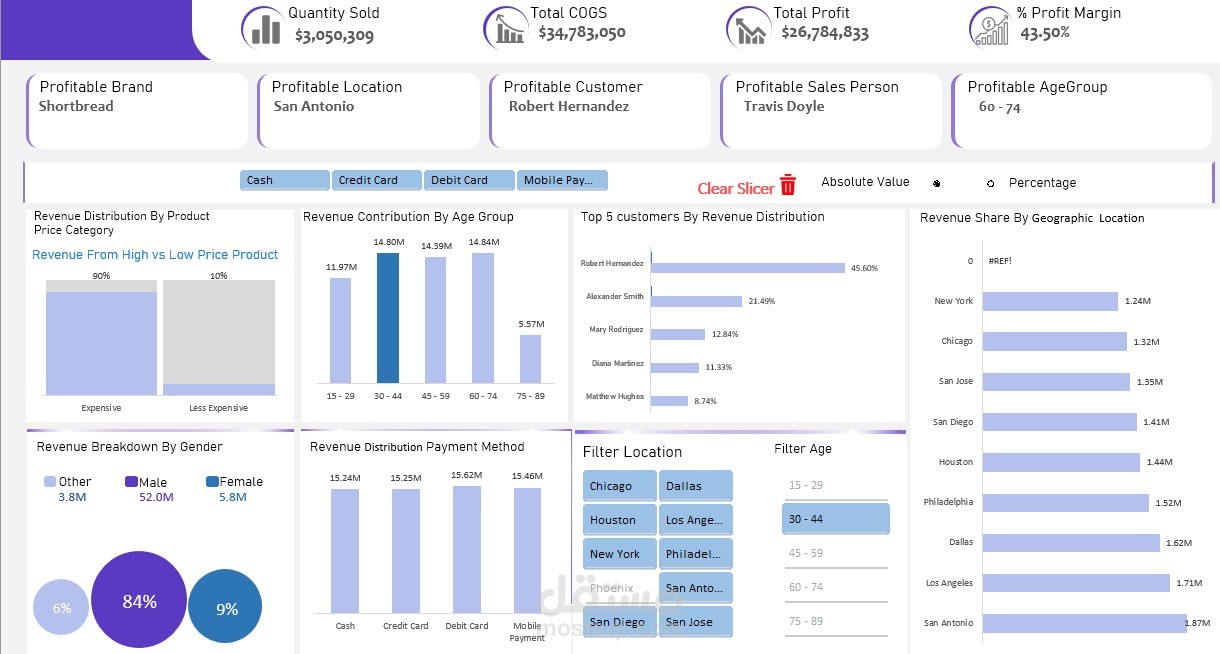
Tools: Microsoft Excel (PivotTables, Formulas, Slicers)
Description: Built an interactive Excel dashboard to analyze revenue performance. Included dynamic filters, view toggling between absolute and percentage values, and conditional highlighting using complex formula logic (GETPIVOTDATA, IF, INDEX, MATCH, VLOOKUP). Also incorporated a Month-over-Month analysis for revenue trends.
This Excel dashboard presents a clear and interactive overview of revenue distribution across different customer age groups, helping identify key contributors to total revenue and profitability.