COVID-19 & Happiness Indicators Data Analysis
تفاصيل العمل
• Used 2 datasets, one COVID19 dataset, published by John Hopkins University consists the cumulative number of confirmed cases of COVID-19 around the world from 22-1-2020 to 30-4-2020, and Worldwide happiness report datasets consist of various life factors scored by people living in each country around the world.
• Performed ETL to prepare the data to analysis, by dropping columns, aggregating rows, finding good measure (max infection rate), merging the datasets using Python & Pandas library on Jupyter notebook
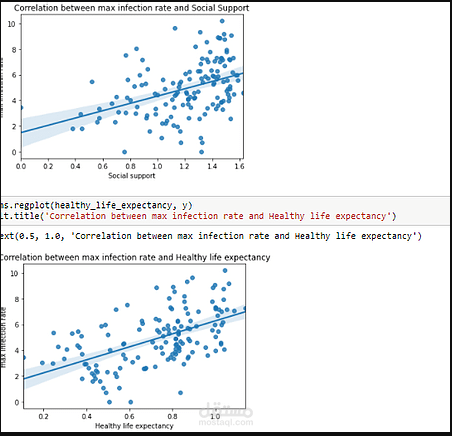
• For analysis, used seaborn to visualize the correlation between the max infection rate & life factors by scatter plot and regression line. Also, used stats from Scipy to find the Pearson Correlation Coefficient, the P-value of a possible correlation and residual plot.
• This project is published in my GitHub account with all the notebooks, codes, & datasets being used and a detailed description of the project in the README.md in repository called COVID-19-&-Happiness-Indicators-Data-Analysis