Relationship Analysis between Suicide Rate & Happiness Report Indicators of a Country 2015-2016
تفاصيل العمل
used 3 datasets, GDP per Capita and Suicide rates for 2000, 2005, 2010, 2015 & 2016, World Happiness Report 2015, and World Happiness Report 2016.
Performed ETL to prepare the data to analysis, by removing columns, splitting
datasets, merging the datasets using Python & Pandas library on Jupyter notebook
Applied descriptive analysis on suicide rates for 2015 & 2016 to have a bigger idea
about the data using boxplot & exploring the top 5 countries for each year.
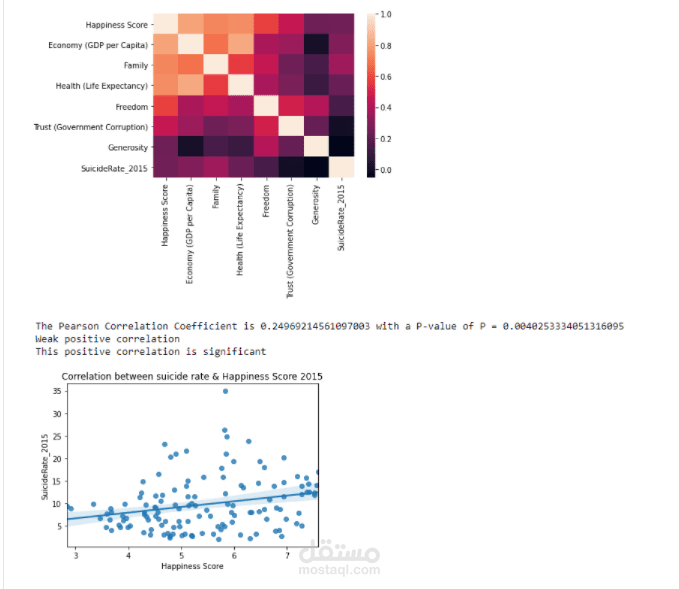
Created a correlation matrix using heat map using seaborn & Pandas libraries.
Created a function that will return a scatter plot with a regression line using seaborn library, the Pearson Correlation Coefficient, the p-value using stats from scipy, & returns if there is a correlation, if the correlation is negative or positive, if it is weak, moderate, strong, or very strong, and if it is significant or not
Visualized residual plots to confirm the possible correlations are linear relationship
Published this project in my GitHub & Kaggle account