Data-Visualization-for-Travel-data
تفاصيل العمل
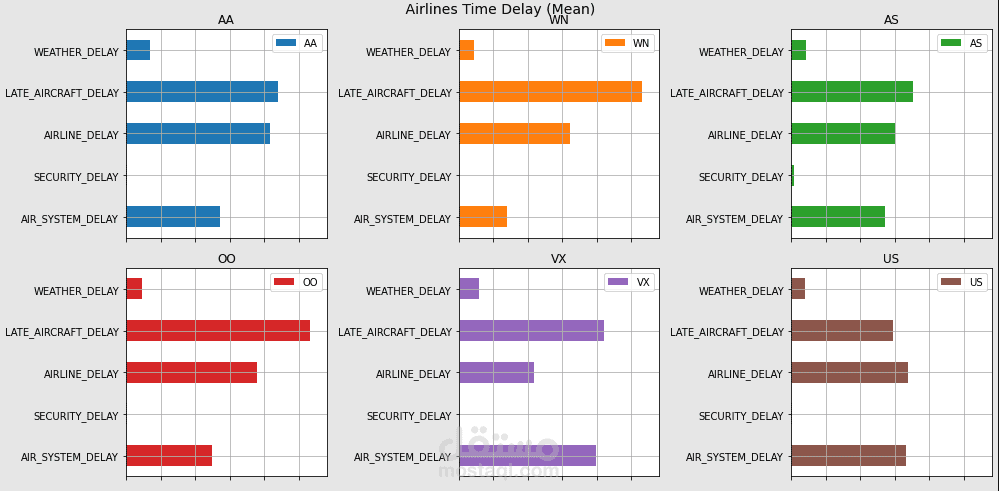
Looking at the characteristics of flight delays and communicate data findings (Insights). Starting with doing preprocessing, cleaning, assessing followed by getting the insights. I used Matplotlib and seaborn libraries for visualization including basics plots like bar , pie and scatter. Also the visualizations includes hist, heatmap, PairGrid and FacetGrid resuling in good key findings for presentation..
بطاقة العمل
| اسم المستقل | Anas R. |
| عدد الإعجابات | 0 |
| عدد المشاهدات | 27 |
| تاريخ الإضافة |

