Executive Enterprise Sales & Profit Margin Intelligence Dashboard | Power BI, Excel & DAX
تفاصيل العمل
Project Overview:
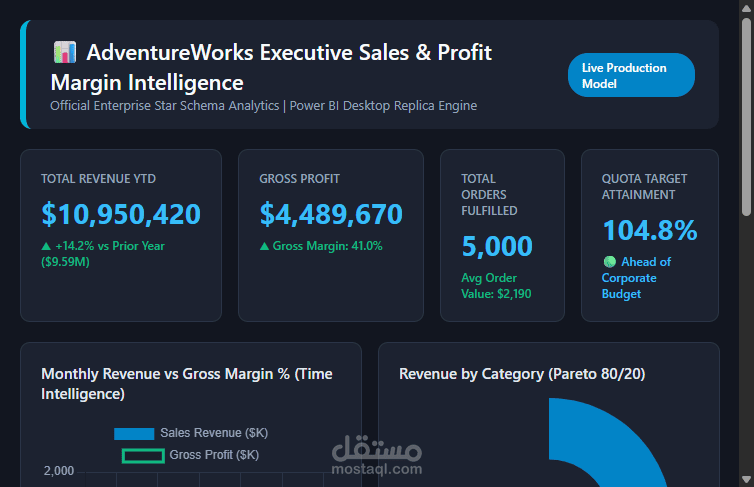
An enterprise Business Intelligence project modeling 5,000 global sales transactions across an authentic AdventureWorks Star Schema architecture. The project delivers real-time visibility into revenue targets, product margins, regional distribution, and time-intelligence benchmarks.
Business Challenge:
Enterprise stakeholders struggled with discrepancies between gross sales volume and net profitability across international subsidiaries, lacking unified visibility into product-level margin performance.
Technical Architecture & DAX Implementation:
1. Star Schema Dimensional Modeling: Connected FactInternetSales (5,000 transactions) to DimDate, DimProduct, and DimTerritory via one-to-many relationships.
2. Advanced DAX Formula Engineering:
- Financial Core: Calculated Total Sales, Total Product Cost, Gross Profit, and Gross Profit Margin %.
- Time Intelligence: Formulated YTD Sales, Prior Year Sales (SAMEPERIODLASTYEAR), and YoY Growth Variance %.
- Moving Benchmarks: Engineered 3-Month Rolling Average sales calculations using DATESINPERIOD.
- Dynamic 80/20 Pareto Classification: Applied ALLSELECTED and RANKX to classify products into Class A (Top 80% revenue drivers) and Class B.
Real Data Findings:
- Volume vs Margin Paradox: The "Bikes" category drove the highest sales volume ($7.85M), while "Accessories" achieved the highest Gross Profit Margin (71.5%).
- Regional Contribution: North America represented 57.1% of gross revenue, with European territories expanding unit velocity.
Deliverables Included:
- Interactive Business Dashboard: 03_AdventureWorks_Interactive_PowerBI_Dashboard.html
- Fully formatted executive spreadsheet: 03_AdventureWorks_Executive_Sales_Dashboard.xlsx
- Complete DAX calculation script: 03_power_bi_adventureworks_dax_measures.dax
- Full Star Schema datasets (FactInternetSales.csv, DimProduct.csv, DimDate.csv, DimTerritory.csv)