Country Development & Economic Performance
تفاصيل العمل
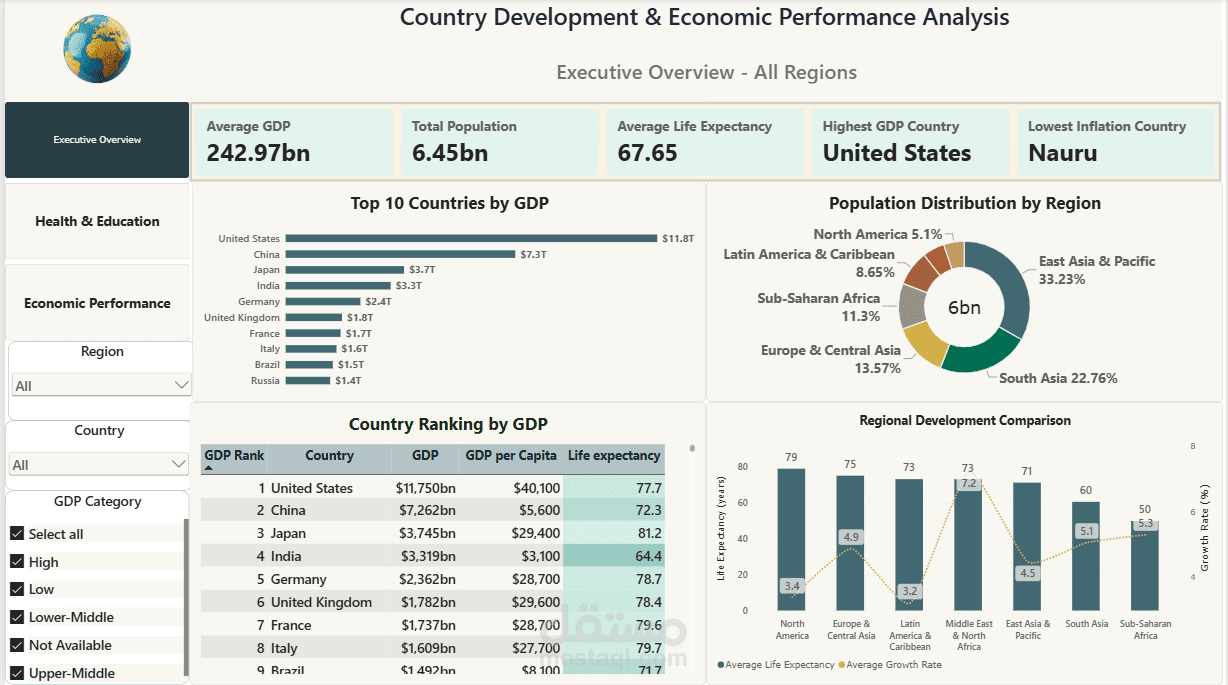
An interactive Power BI dashboard that compares 237 countries across 7 regions on economy, health and development. It lets anyone see quickly which regions lead, where the gaps are, and drill into any single country.
What I did:
Cleaned the data in Power Query: from 263 rows and 45 columns down to 237 countries and 17 columns.
Kept missing values blank instead of replacing them with zero, so averages stay accurate.
Built a Regions table and linked it to the main table.
Wrote 28 DAX measures: KPI cards, GDP ranking, growth, trade balance, and titles that change with the filters.
Designed 3 pages: Executive Overview, Health & Education (with a life expectancy map), and Economic Performance.
Added region, country and GDP-category slicers, a country drill-through page, and hover tooltips.
Key findings:
Average life expectancy ranges from about 79 years in North America to about 50 in Sub-Saharan Africa.
Internet use ranges from 53.3% in North America to 1.0% in Sub-Saharan Africa.
Sub-Saharan Africa has the highest average inflation, at 10.1%.
Tools: Power BI, Power Query, DAX