Sales Dashboard project using Excel.
تفاصيل العمل
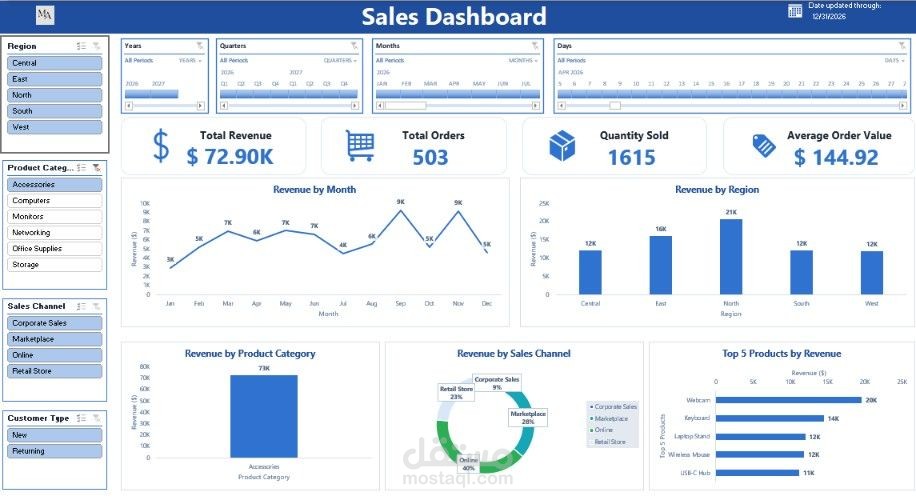
I worked on a Sales Dashboard project using Excel.
I started with raw sales data, analyzed it using PivotTables, and turned it into an interactive dashboard to make sales insights easier to understand.
What I worked on:
-Created KPIs: Total Revenue, Total Orders, Quantity Sold, and Average Order Value.
-Analyzed sales by month, region, product category, and sales channel.
-Identified the Top 5 Products by Revenue.
-Added interactive filters to explore the data from different perspectives.
This project gave me hands-on practice with Excel, PivotTables, and data visualization. Im still learning, practicing, and improving my skills with every project.