Product Sales & Performance Dashboard | Power BI*
تفاصيل العمل
I'm excited to share my latest Data Analytics project, where I worked on analyzing sales data and building an interactive dashboard using *Microsoft Power BI*.
Throughout this project, I worked on several stages of the data analysis process:
🔹 *Data Preparation:*
- Data Cleaning and Transformation using Power Query.
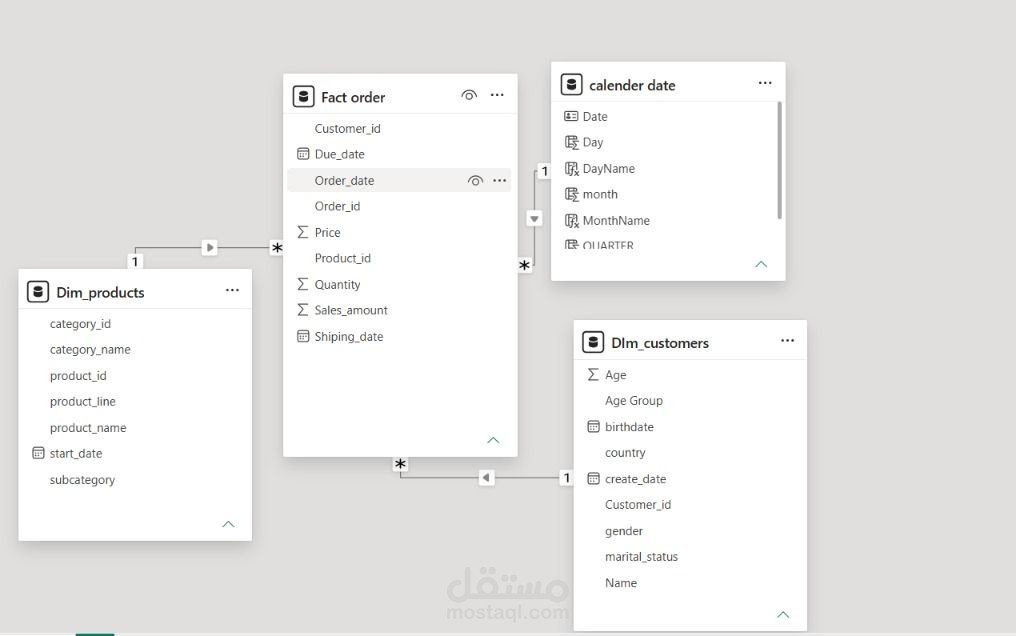
🔹 *Data Modeling:*
- Building a Star Schema data model.
- Creating relationships between Fact and Dimension tables.
🔹 *Data Analysis:*
- Creating DAX measures to calculate key performance indicators (KPIs).
- Analyzing sales performance across different product categories and subcategories.
- Exploring customer and product-related insights.
🔹 *Dashboard Development:*
- Designing an interactive dashboard.
- Using KPIs, Bar Charts, and Decomposition Tree for detailed analysis.
*Key Metrics:*
- Total Sales: 29M
- Total Quantity: 60K
- Total Products: 130
- Total Orders: 28K
- Total Customers: 18K
*Tools Used:*
Microsoft Power BI | Power Query | DAX
This project was a great opportunity to apply my analytical skills and strengthen my understanding of data modeling, DAX, and data visualization.
Always learning and improving!