Superstore 360° Sales & Operations Dashboard (Excel)
تفاصيل العمل
Project Overview:
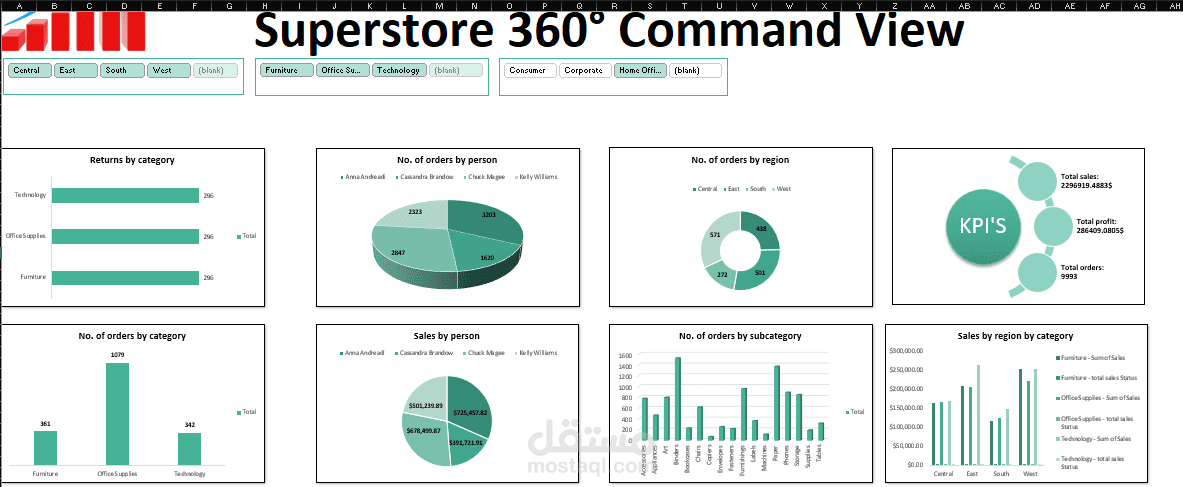
This project features a comprehensive "360° Command View" dashboard built entirely in Microsoft Excel. Using the Superstore dataset, I designed this interactive dashboard to provide a complete overview of business performance across sales, profit, orders, and returns. It allows stakeholders to filter data dynamically by Region, Category, and Customer Segment to uncover actionable insights.
Key Features of the Dashboard:
Interactive Slicers: Top-level filtering by Region (Central, East, South, West), Product Category (Furniture, Office Supplies, Technology), and Customer Segment (Consumer, Corporate, Home Office).
High-Level KPIs: Summary cards displaying Total Sales ($2.29M+), Total Profit ($286K+), and Total Orders (5009+).
Returns Analysis: A bar chart tracking the number of returned items by Category, helping to identify problem areas.
Performance by Personnel: Donut charts breaking down both the volume of orders and total sales generated by individual team members (e.g., Anna Andreadi, Cassandra Brandow).
Regional Insights: Visualizations showing the number of orders and total sales by Region, allowing for geographical performance comparison.
Sub-Category Deep Dive: A detailed column chart showing the number of orders across various sub-categories (e.g., Appliances, Binders, Chairs, Phones).
Cross-Category Sales: A clustered chart comparing sales performance across different regions broken down by the main product categories.
Tools & Techniques Used:
Microsoft Excel: Pivot Tables, Pivot Charts, Slicers, and Dashboard Design.
Data Visualization: Custom color formatting, layout optimization for clear storytelling, and dynamic linking of all charts to the slicers.
Business Value:
This dashboard enables management to instantly identify their most profitable regions, track salesperson performance, monitor product return rates, and understand which sub-categories drive the most order volume, ultimately supporting faster and more accurate business decisions.
3. Project Tags / Skills (if needed)
Excel, Data Analysis, Dashboard, Pivot Tables, Data Visualization, Business Intelligence, Sales Analytics, Microsoft Excel.