Successful Projects Analysis Dashboard | Power BI
تفاصيل العمل
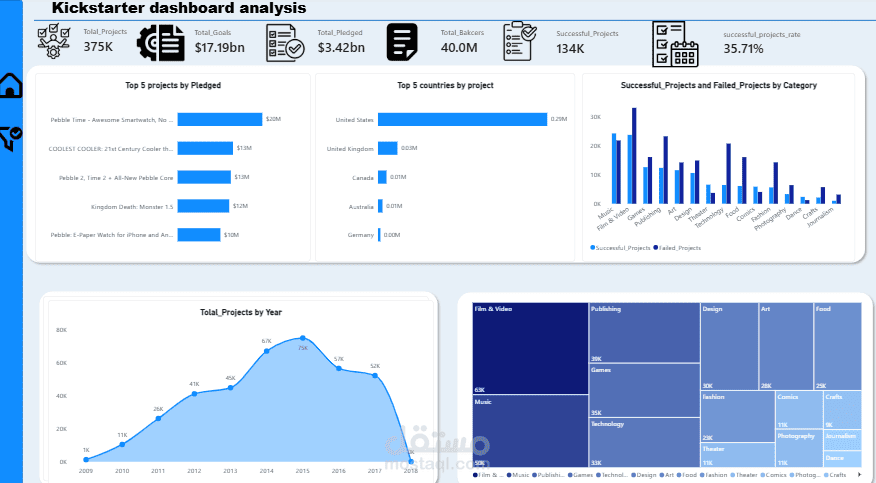
## Successful Projects Analysis Dashboard – Power BI
Developed an interactive Power BI dashboard to analyze successful projects across different countries, categories, and subcategories.
**Key Features:**
- **KPI Analysis:** Total Projects, Total Goals, Total Pledged, Total Backers, Successful Projects, and Success Rate.
- **Category Analysis:** Compared pledged amounts across different project categories.
- **Geographical Analysis:** Analyzed project performance and pledged amounts by country.
- **Interactive Decomposition Tree:** Explored project success by country, category, and subcategory.
- **Data Visualization:** Designed interactive charts and a clean dashboard layout to support data-driven decision-making.
**Tools & Skills:** Microsoft Power BI, Data Visualization, Business Intelligence, Data Analysis, and Interactive Reporting.
**Project Objective:** To identify the countries and categories contributing most to successful projects and provide clear insights into overall project performance.