Interactive Sales & Profit Analysis Dashboard - Adidas
تفاصيل العمل
Project Overview:
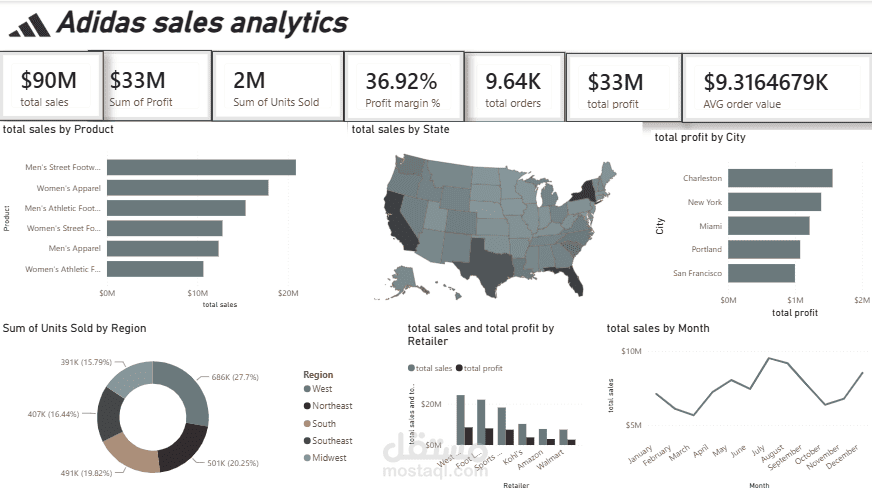
In this project, I developed an interactive Sales Analytics Dashboard for "Adidas" to transform raw data into actionable business insights. The goal was to provide a comprehensive view of the company's sales performance, profitability, and regional trends to aid in data-driven decision-making.
Key Features of the Dashboard:
Executive KPIs: A high-level summary of Total Sales ($90M), Total Profit ($33M), Units Sold (2M), Profit Margin (36.92%), Total Orders, and Average Order Value.
Product Performance: Horizontal bar charts analyzing total sales by product category (e.g., Men's Street Footwear, Women's Apparel).
Geographical Analysis: An interactive map highlighting total sales by State, alongside a breakdown of total profit by top Cities (e.g., Charleston, New York, Miami).
Retailer Insights: A combined bar/line chart comparing total sales and total profit across different retailers (West Gear, Foot Locker, Sports Direct, etc.).
Time-Series Analysis: A line graph tracking total sales by Month to identify seasonal trends and peak performance periods.
Regional Distribution: A donut chart showing the sum of units sold by Region (West, Northeast, South, Southeast, Midwest).
Tools Used:
Power BI
Business Value:
This dashboard allows stakeholders to quickly identify which products and regions are driving the most revenue, evaluate retailer performance, and spot seasonal sales trends, ultimately enabling more strategic planning and resource allocation.