Interactive Sales Performance Dashboard in Power BI
تفاصيل العمل
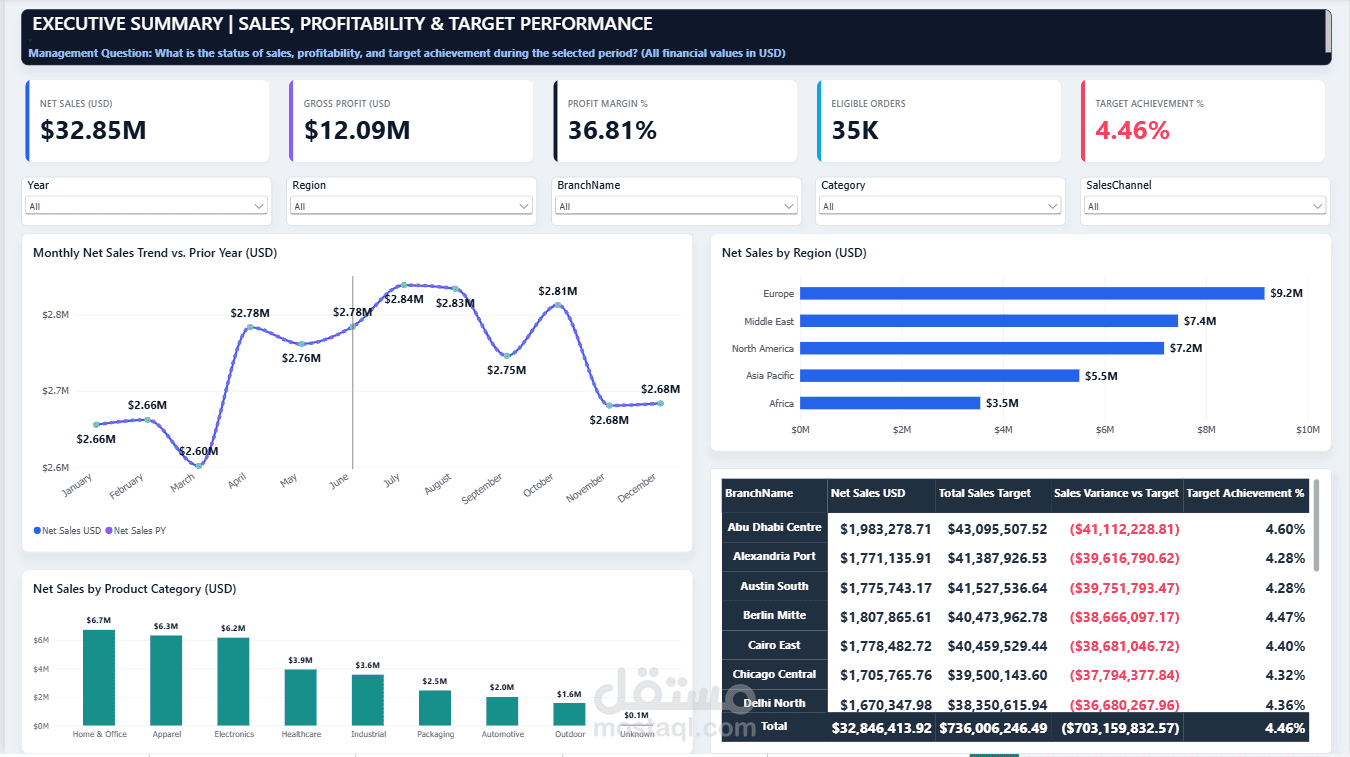
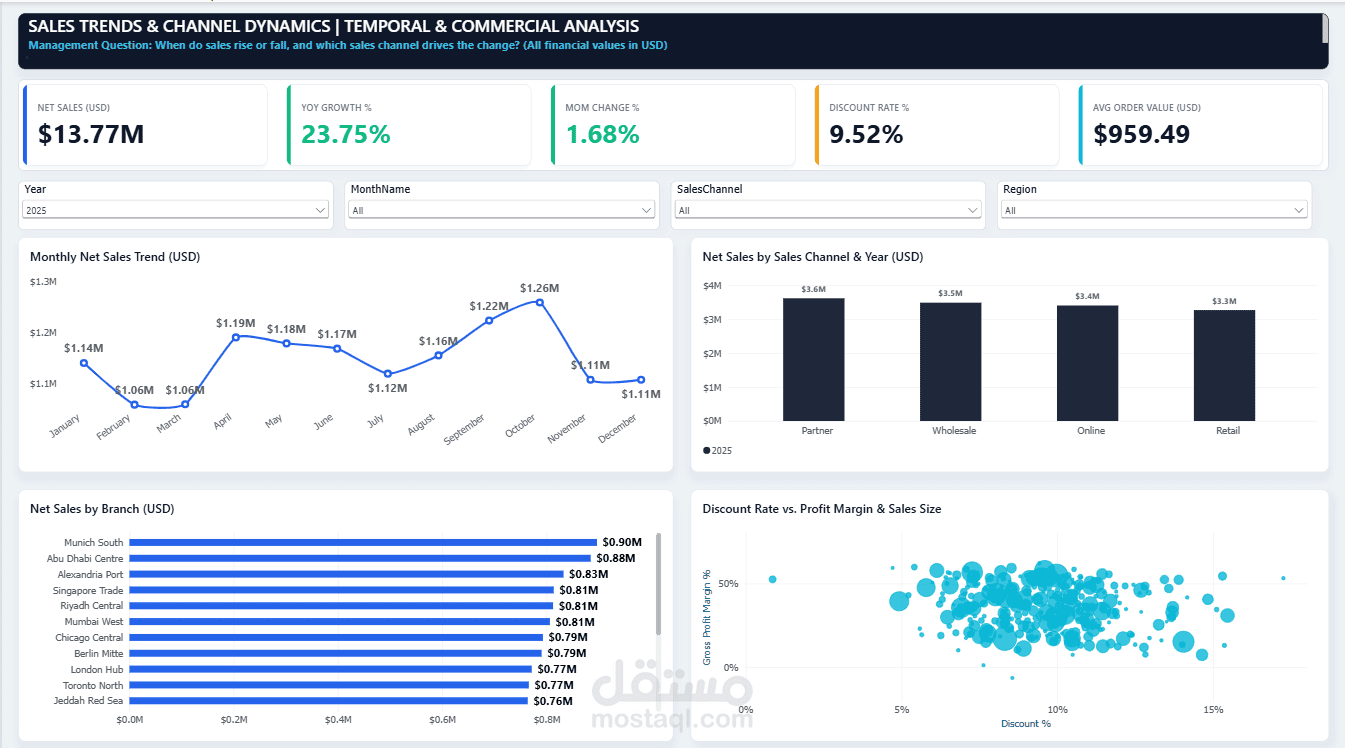
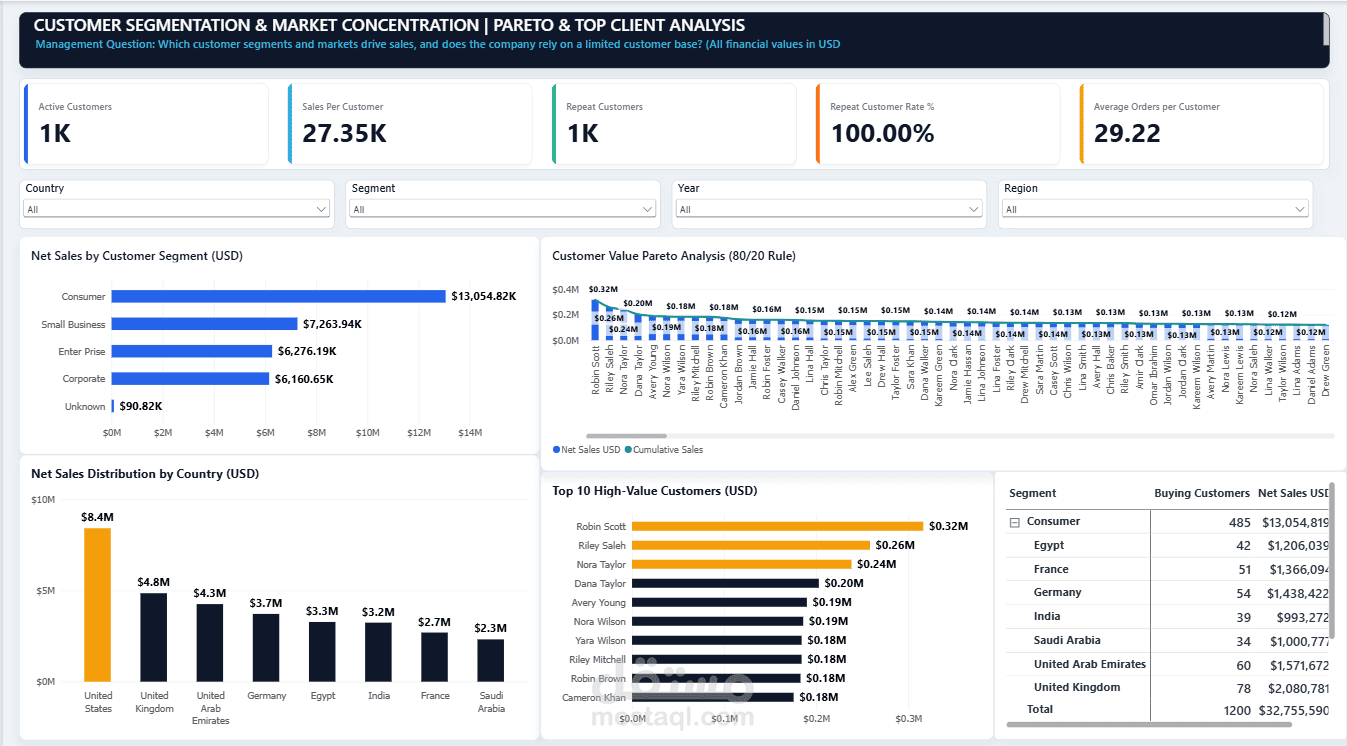
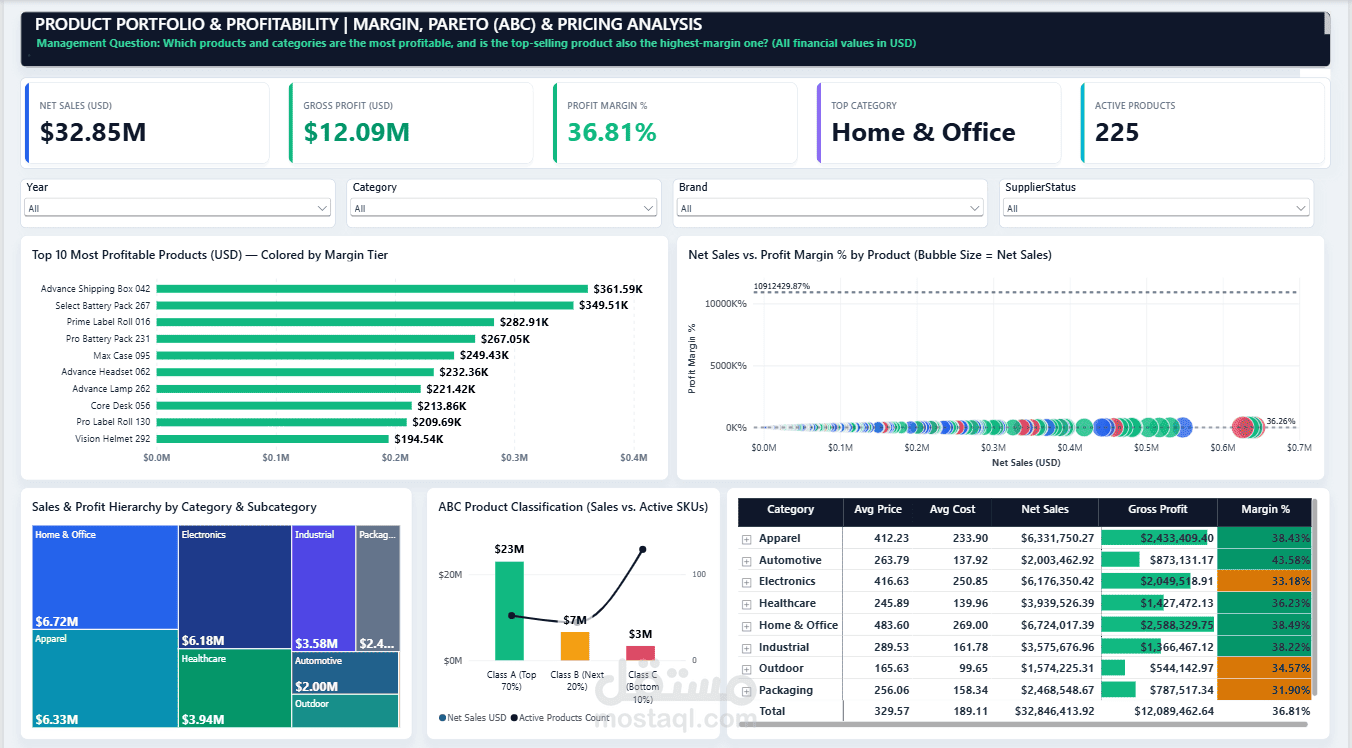
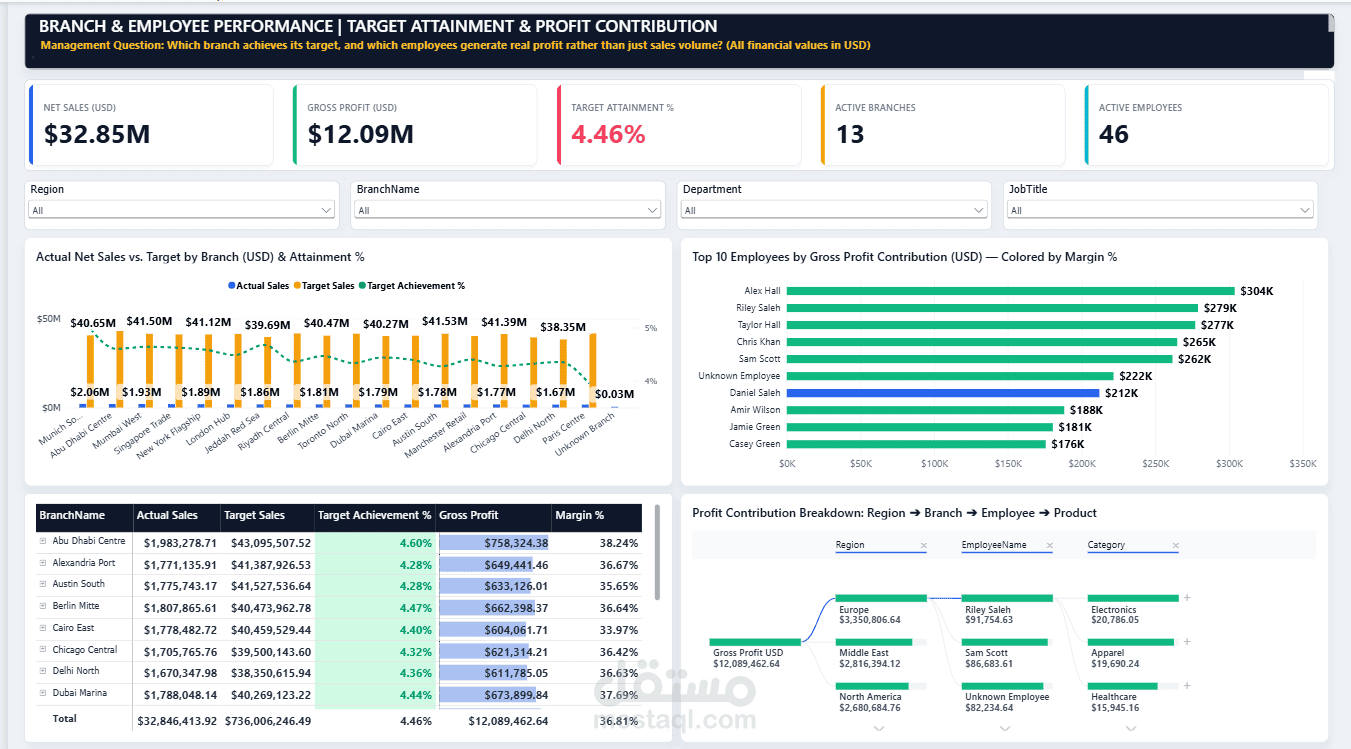
Project Overview:
Designed and developed a comprehensive, multi-page Sales Performance Dashboard in Microsoft Power BI to track revenue trends, profit margins, regional performance, and product KPIs.
Key Technical Tasks Implemented:
- Data Cleaning & Preparation: Processed and transformed raw sales records using Power Query to ensure 100% data accuracy.
- Data Modeling: Built an optimized Star Schema model connecting fact and dimension tables for fast report performance.
- Advanced DAX Measures: Created custom DAX calculations for Year-over-Year (YoY) growth, profit margin percentages, moving averages, and dynamic targets.
- Interactive Visualization: Applied conditional formatting, drill-through pages, and dynamic slicers to allow stakeholders to filter insights by date, region, product category, and sales channel.
Business Impact:
Enabled clear visibility into top-performing products and underperforming regions, turning thousands of raw transaction rows into actionable executive insights.