Delivery Operations Dashboard – Power BI Project
تفاصيل العمل
# Delivery Operations Dashboard – Power BI Project
## Project Overview
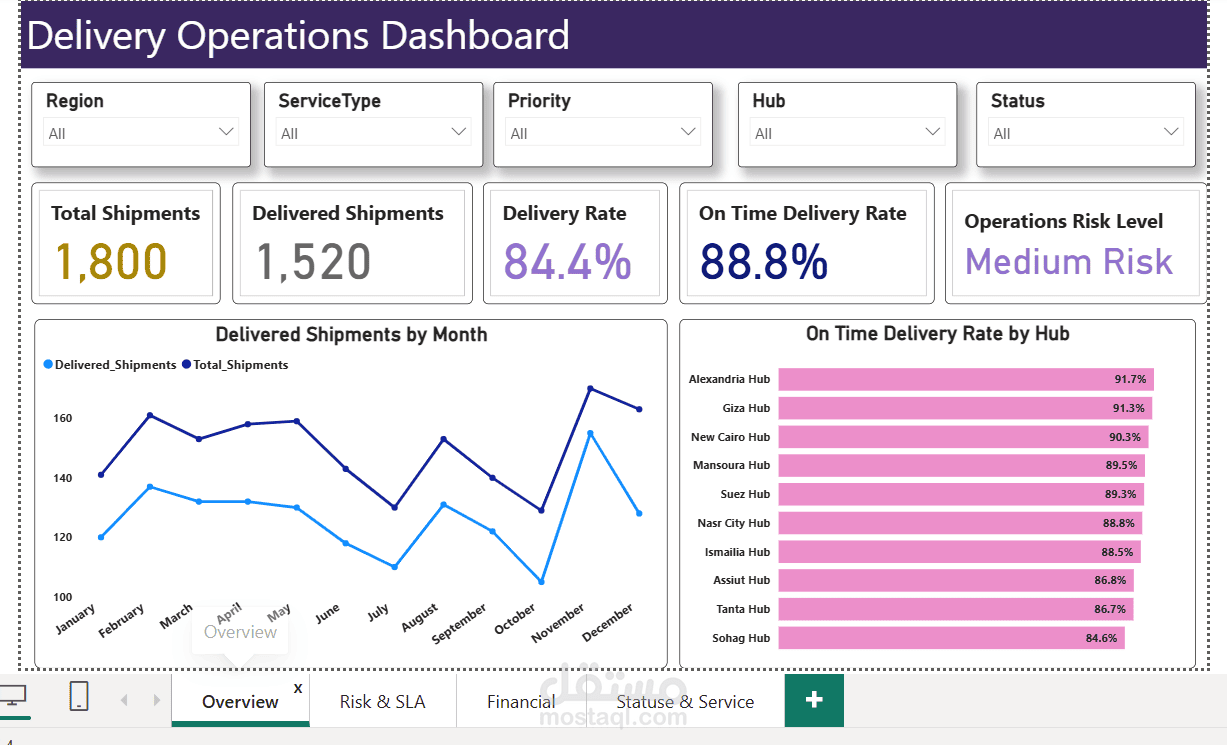
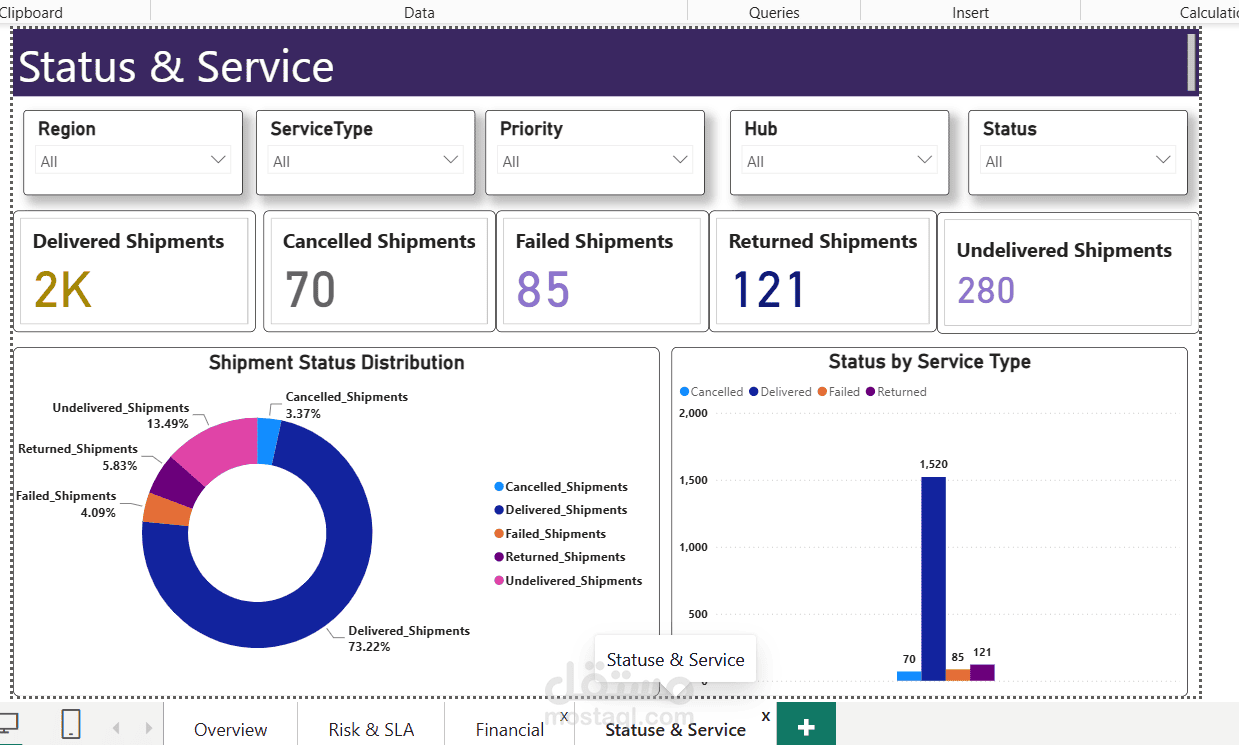
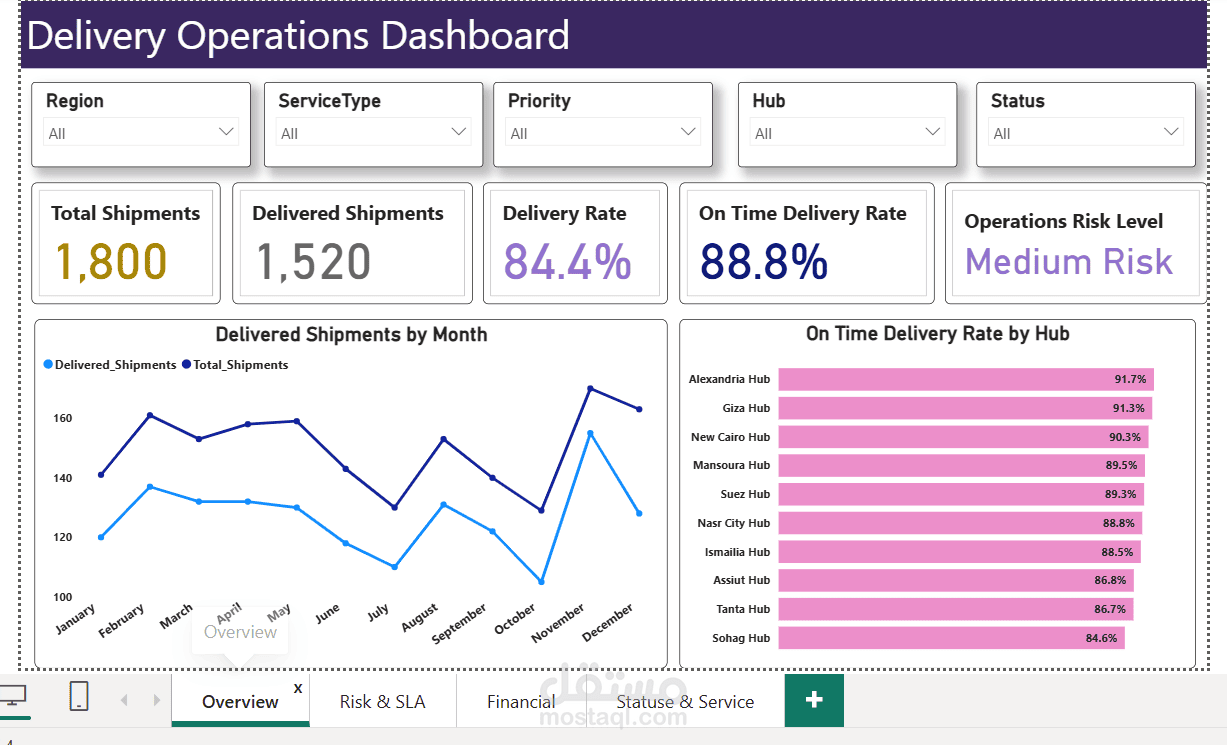
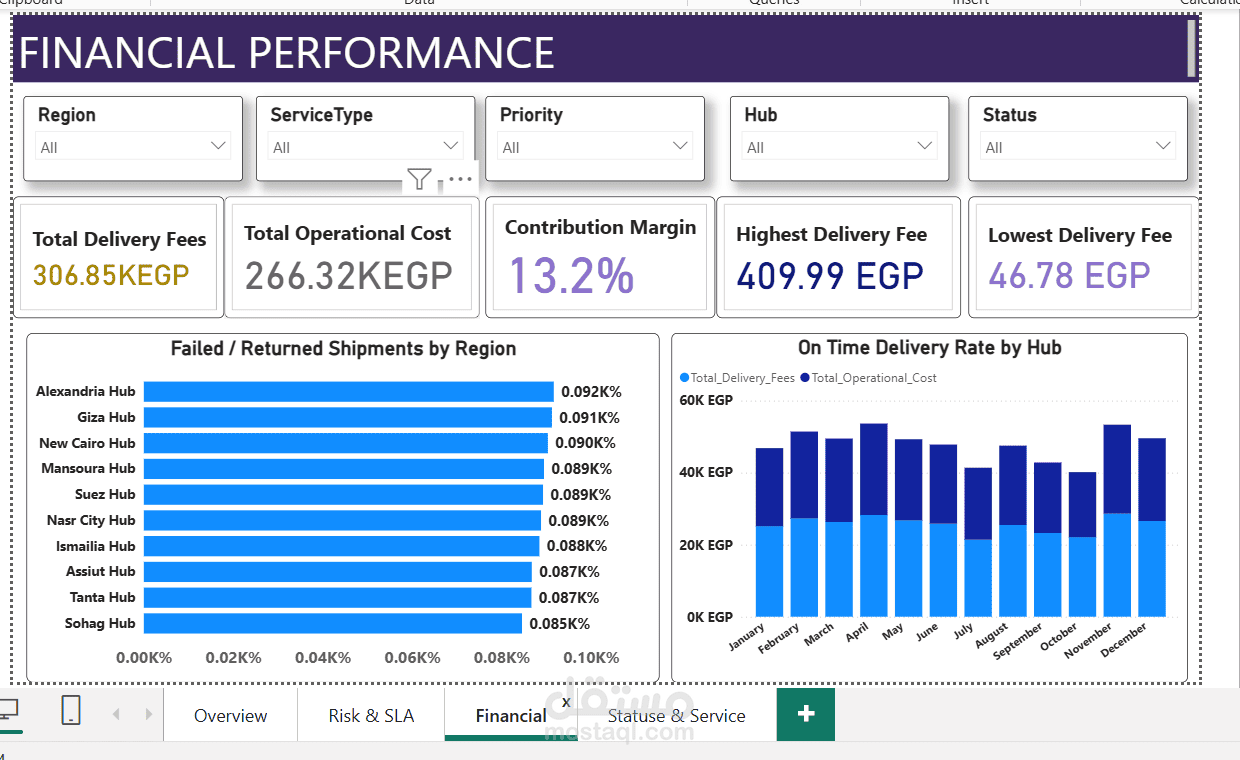
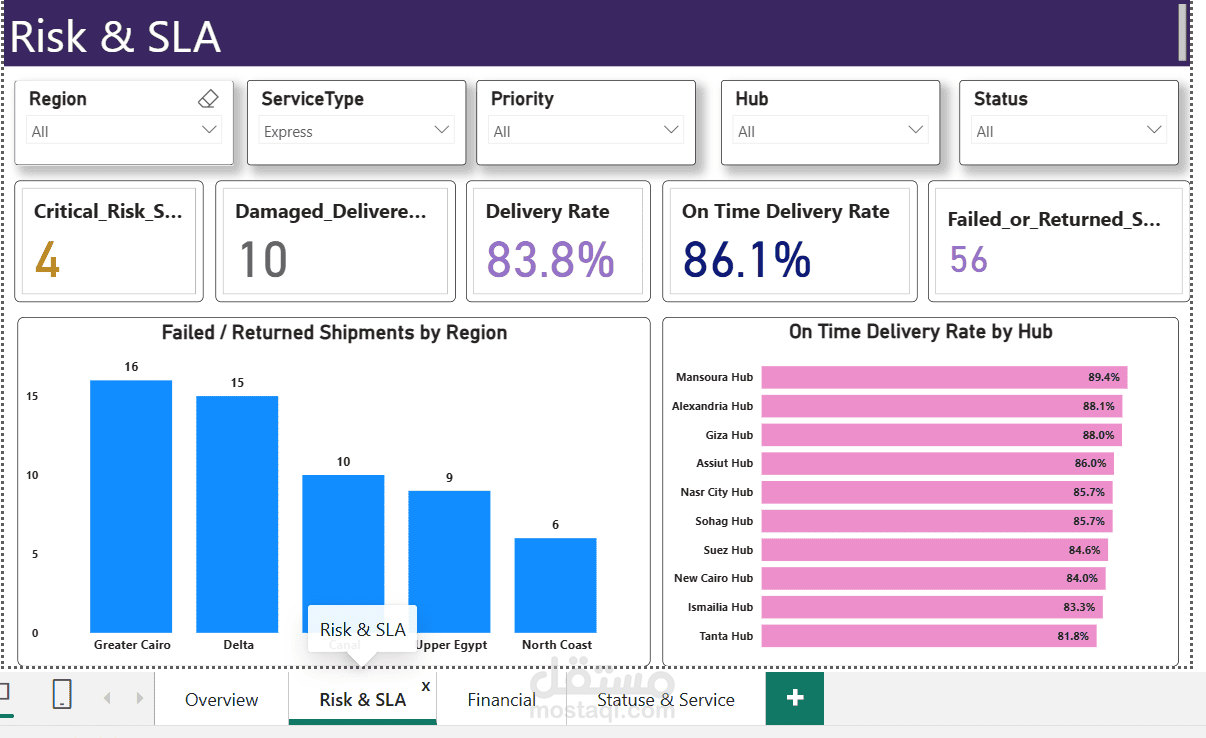
The Delivery Operations Dashboard is an interactive Power BI report designed to monitor and analyze delivery performance and operational efficiency. It provides an overview of shipment volumes, successful deliveries, on-time delivery performance, and operational risk levels.
The dashboard allows users to explore delivery operations across different regions, service types, priorities, hubs, and shipment statuses. It combines key performance indicators (KPIs), monthly trend analysis, and hub-level comparisons in one place, making it easier to understand operational performance and identify areas that may need improvement.
The main objective of this project is to transform delivery data into clear and useful insights that support data-driven decision-making, improve delivery performance, and help operations teams monitor service quality.