Interactive Sales Analysis Dashboard Using Tableau
تفاصيل العمل
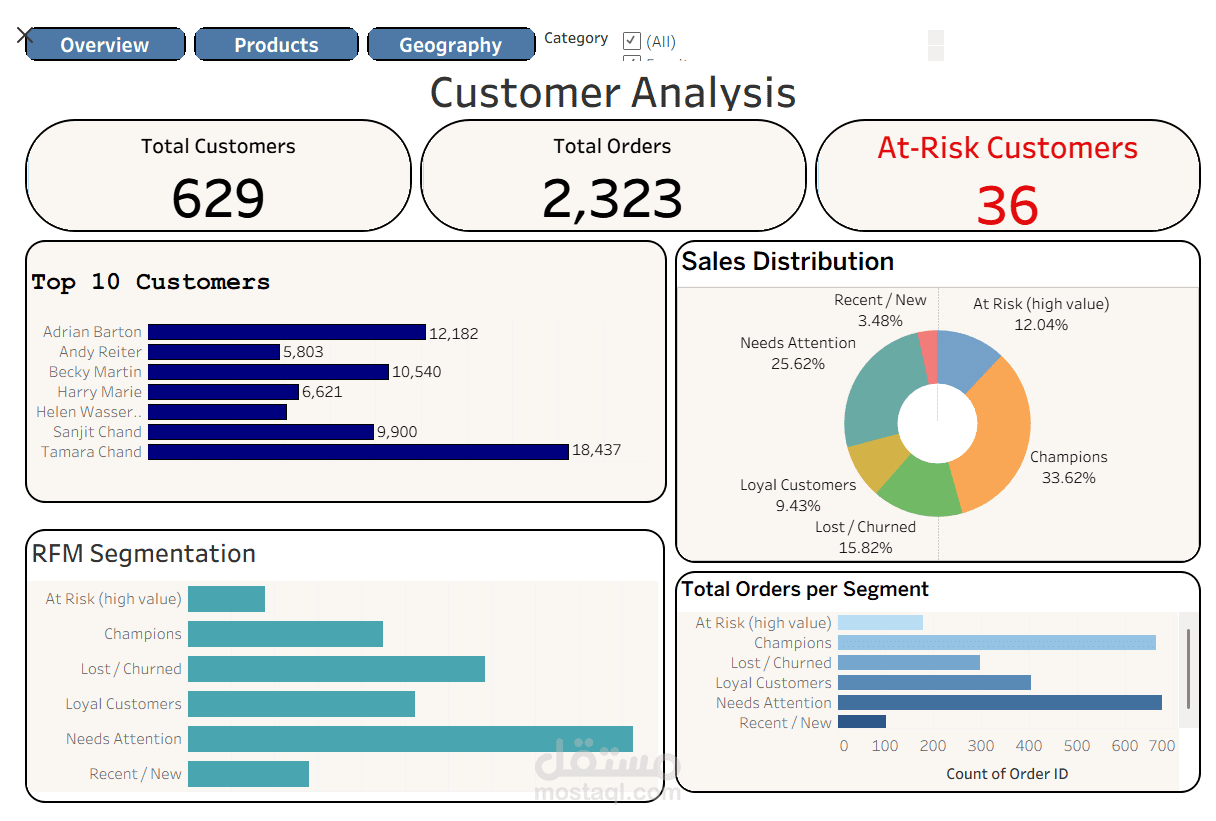
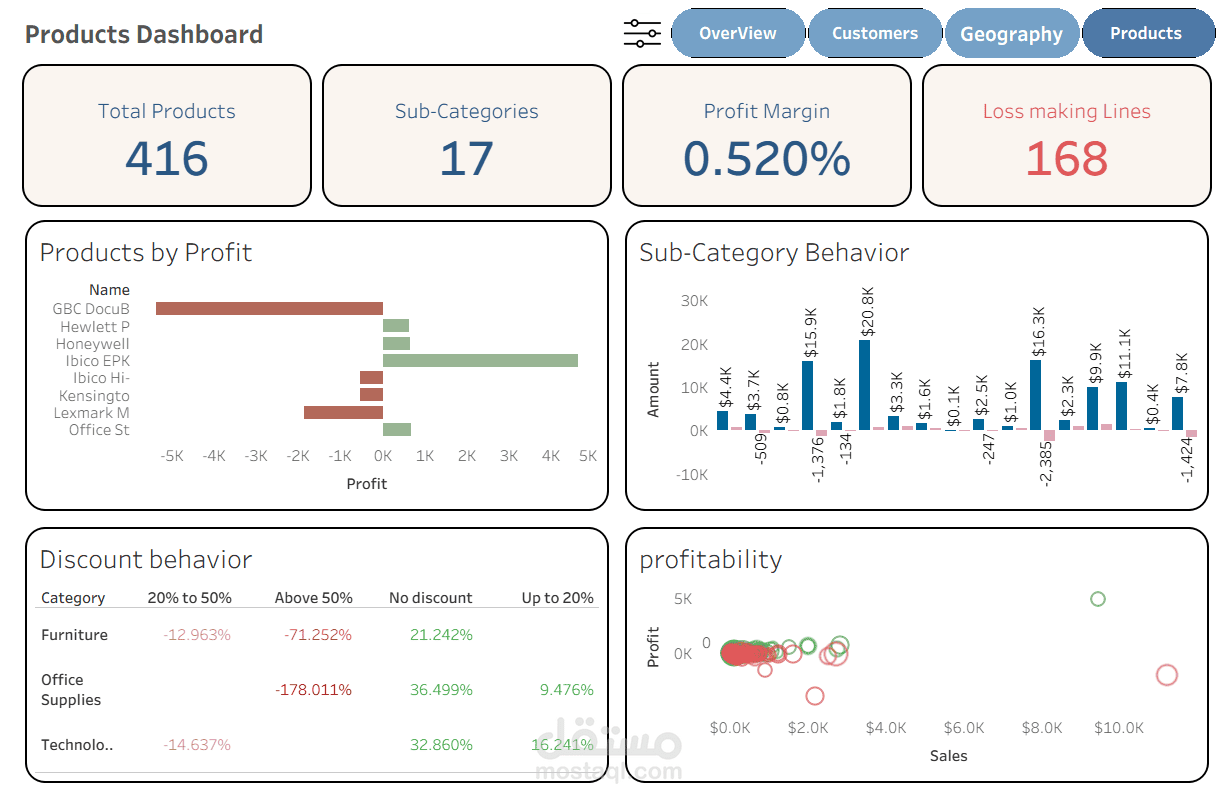
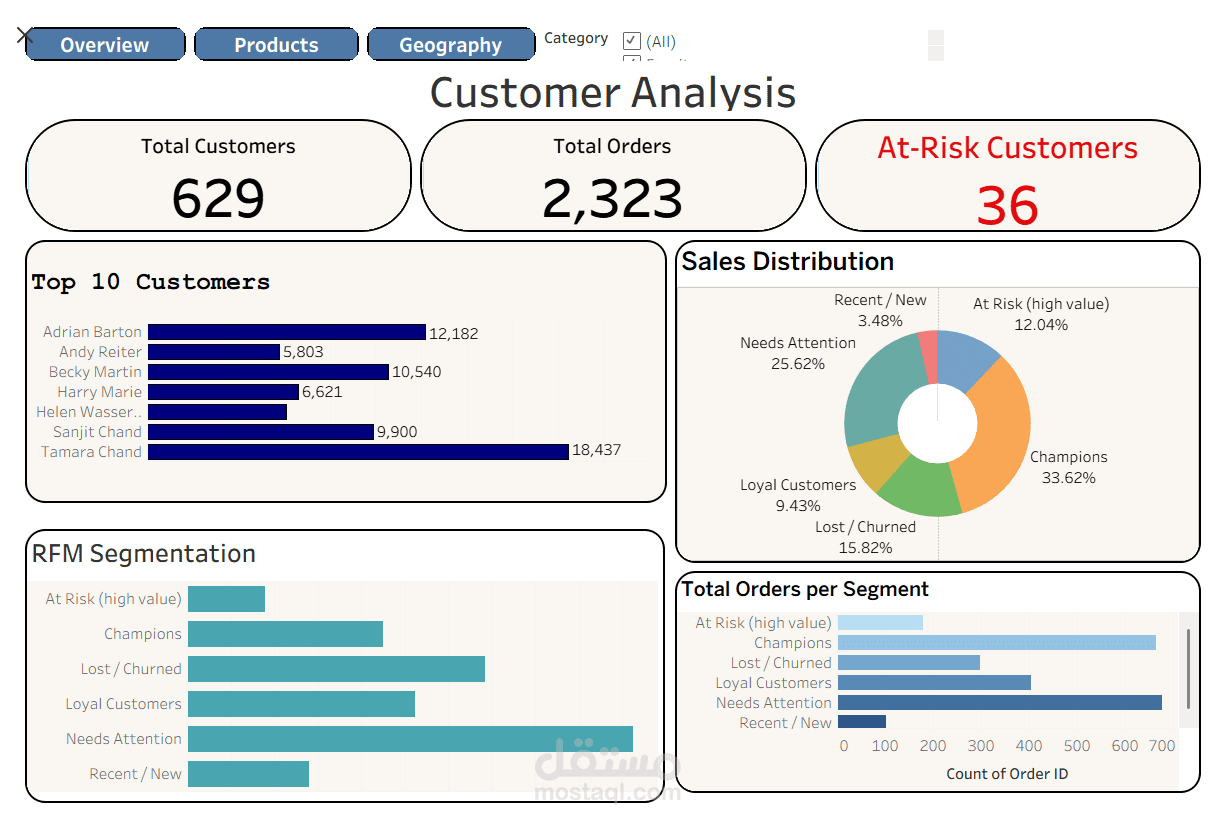
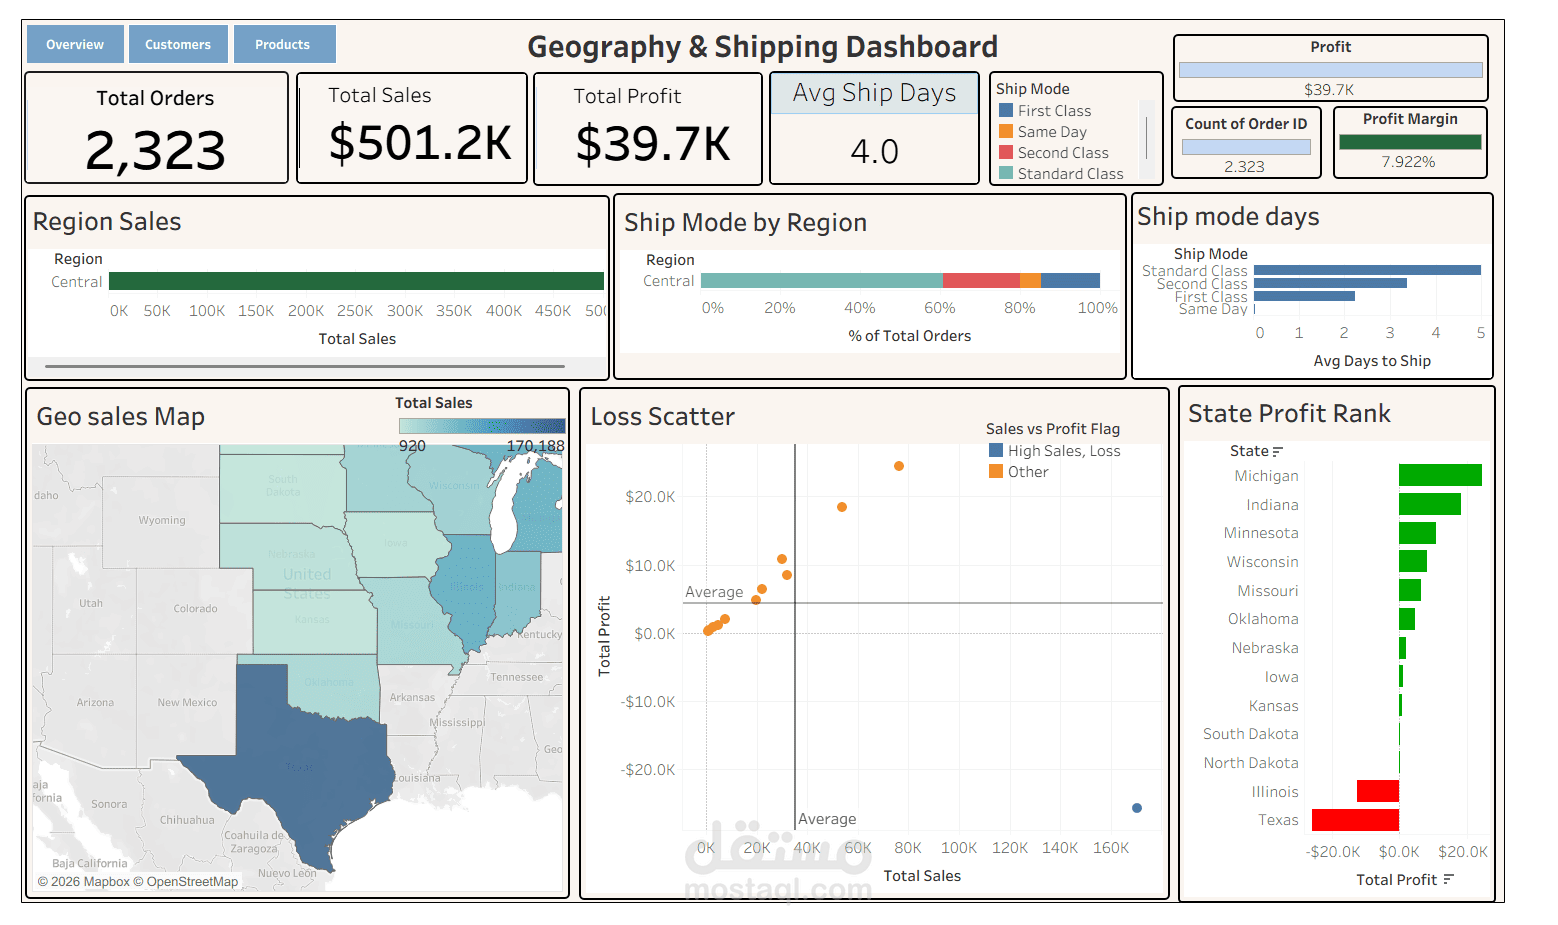
Developed an interactive sales analysis dashboard using Tableau to explore business performance and transform raw data into meaningful insights.
The project includes three dashboards:
- **Overview Dashboard:** Presents key performance indicators (KPIs) and an overall summary of sales performance.
- **Product Dashboard:** Analyzes product performance and helps identify top-performing products.
- **Geographic Dashboard:** Visualizes sales performance across different geographical areas.
The project focuses on data visualization, interactive dashboards, and presenting business insights in a clear and organized way to support data-driven decision-making.