Advanced SQL Data Warehouse & Business Analytics
تفاصيل العمل
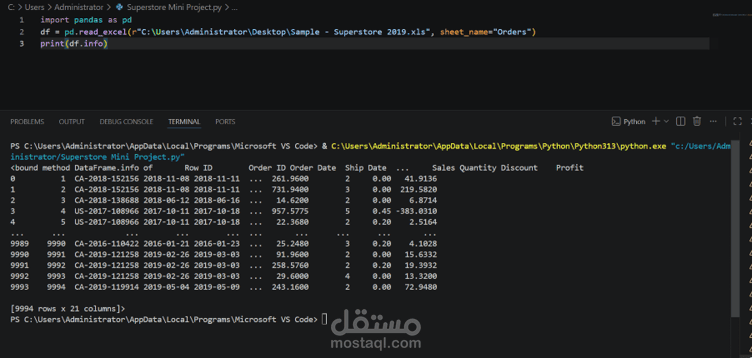
Project Description
Developed a data analysis project using Python to explore and analyze Superstore sales data, uncover business insights, and evaluate sales performance through data cleaning, exploratory data analysis, and visualization.
The project involved processing the original dataset, handling data quality issues, analyzing key business performance indicators, and creating visualizations to identify trends and patterns in sales and profitability.
Key Features
Data Cleaning and Preparation: Cleaned and prepared the raw Superstore dataset for accurate and reliable analysis.
Exploratory Data Analysis (EDA): Investigated sales data to identify patterns, trends, and relationships across different business dimensions.
KPI Analysis: Evaluated key performance indicators, including total sales, profit, and other relevant business metrics.
Data Visualization: Created charts to communicate findings and highlight important trends in business performance.
Business Insights: Analyzed product and sales performance to support better understanding of business results.
Data Export: Exported the cleaned dataset for further analysis and reporting.
Tools & Technologies
Python
Pandas
NumPy
Matplotlib and Seaborn
Jupyter Notebook
Visual Studio Code
Excel
Project Objective
The objective of this project was to transform raw sales data into meaningful insights through Python-based data analysis. It demonstrates practical skills in data preparation, exploratory analysis, KPI calculation, data visualization, and communicating findings to support data-driven decision-making.