Superstore Analytics Dashboard – Power BI
تفاصيل العمل
Superstore Analytics Dashboard – Power BI
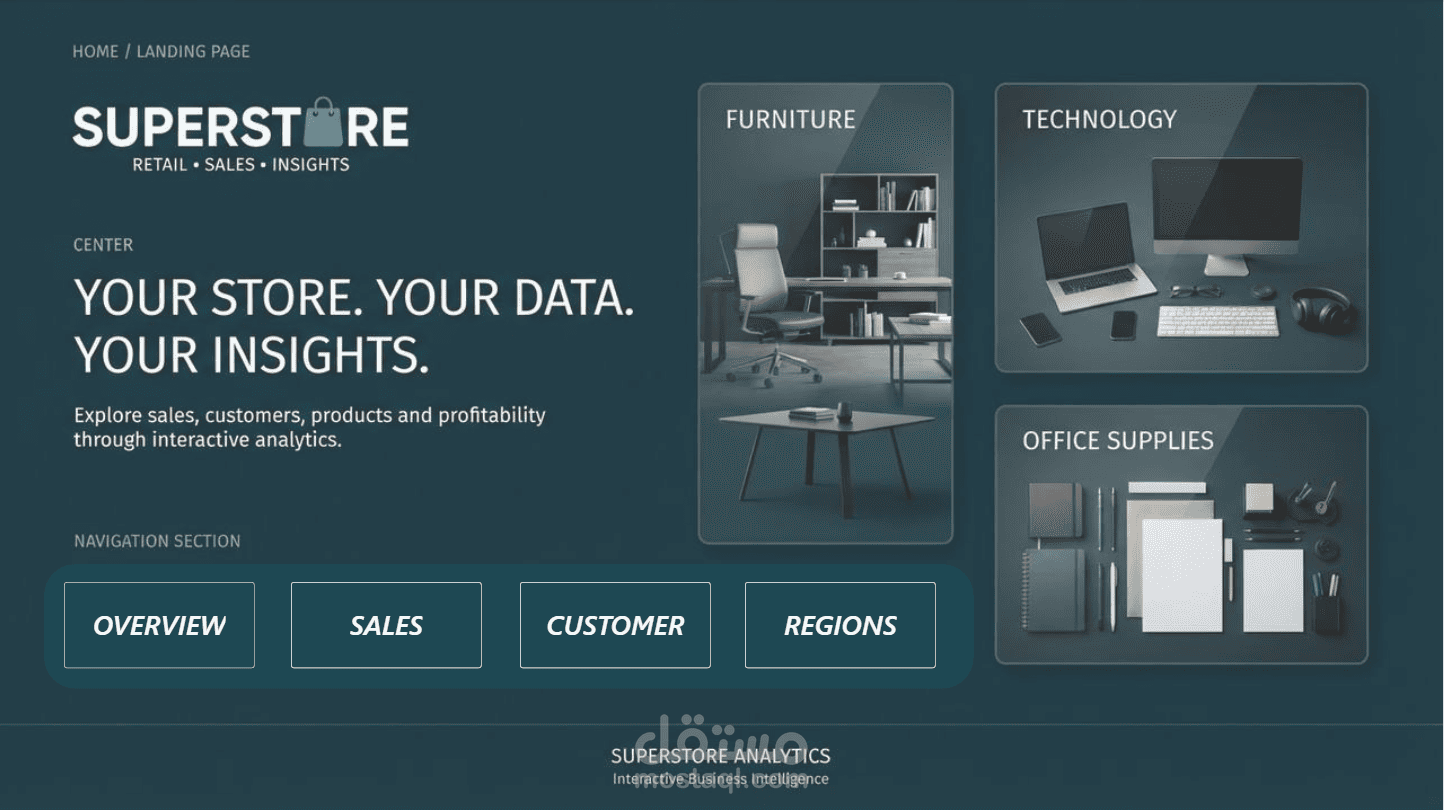
Developed an interactive Superstore Retail Analytics Dashboard using Power BI to track sales, customers, products, and regional performance through a multi-page report with a custom landing page and navigation menu.
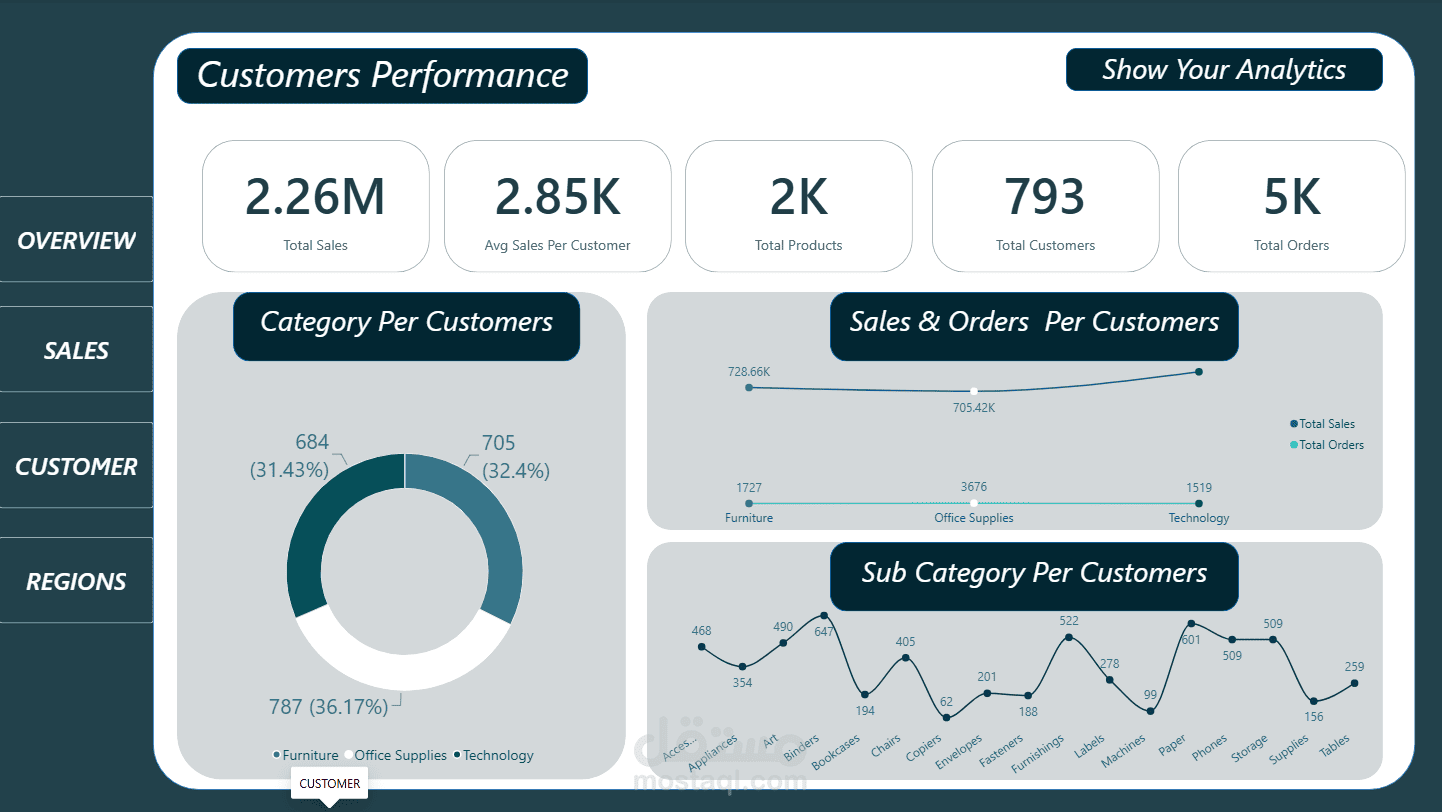
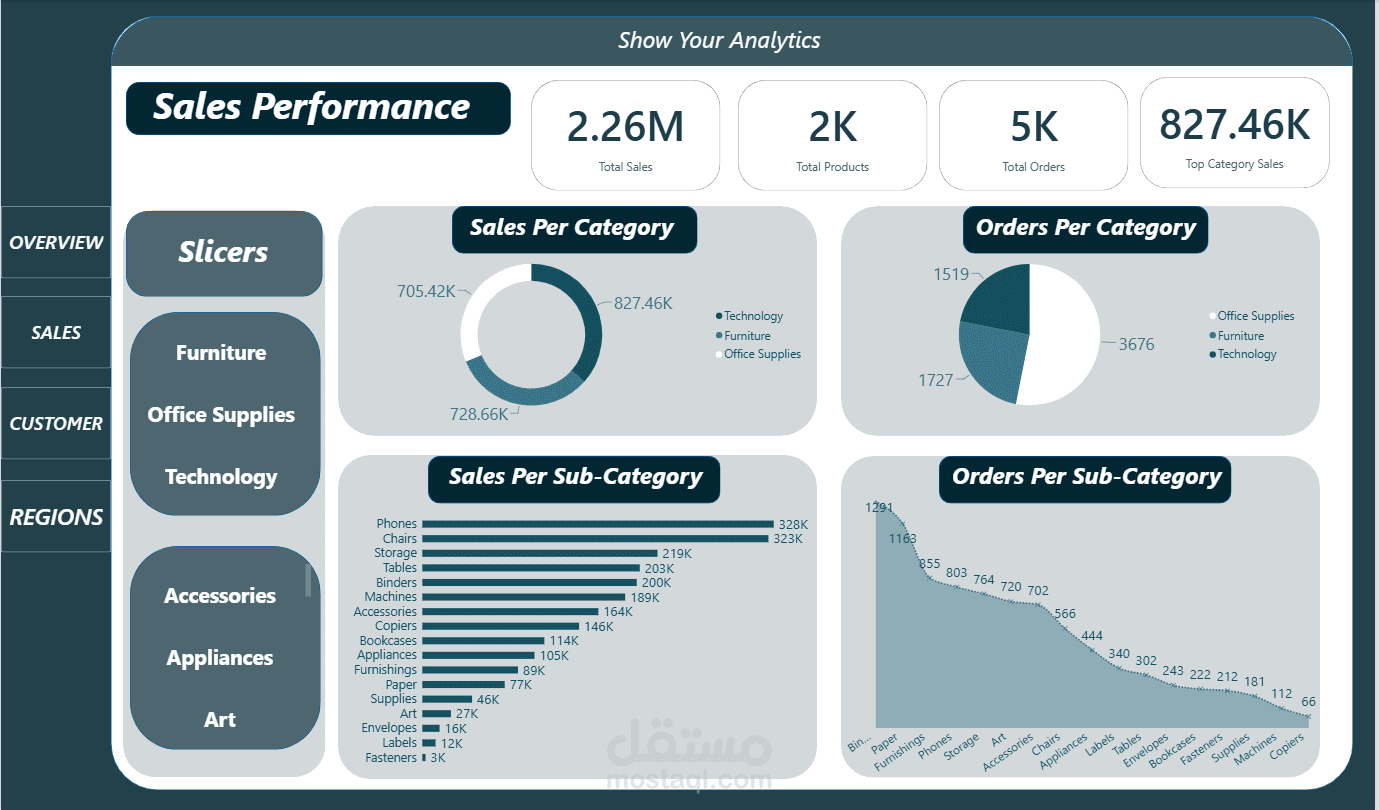
• Analyzed key KPIs including total sales (2.26M), total orders (5K), total products (2K), and total customers (793).
• Evaluated sales and order performance by category (Furniture, Office Supplies, Technology) and by sub-category, highlighting top performers such as Phones and Chairs.
• Analyzed customer behavior through average sales per customer (2.85K), category distribution across customers, and sales and orders per customer.
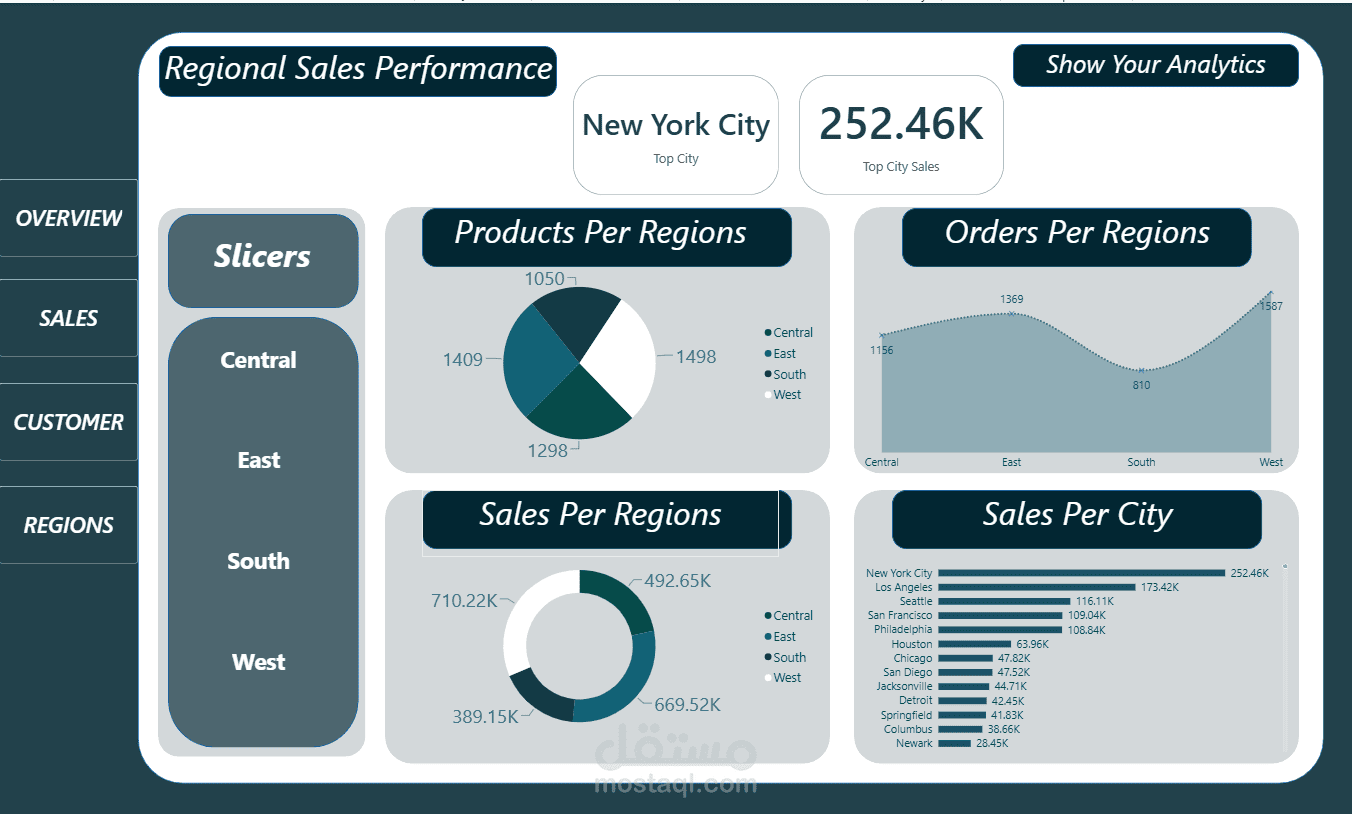
• Compared sales and order volume across regions (Central, East, South, West) to identify the strongest markets.
• Identified top-performing cities by sales, led by New York City (252.46K), followed by Los Angeles and Seattle.
• Added interactive slicers for Category, Sub-Category, and Region, plus a navigation menu linking Overview, Sales, Customer, and Regions pages.
• Designed a clean teal-themed dashboard focused on business insights, performance monitoring, and data-driven decision making.
Tools: Power BI | Data Cleaning | Data Analysis | Data Visualization | DAX | Interactive Dashboards