analysis
تفاصيل العمل
Python Data Analysis Project – Sales and Profit Analysis
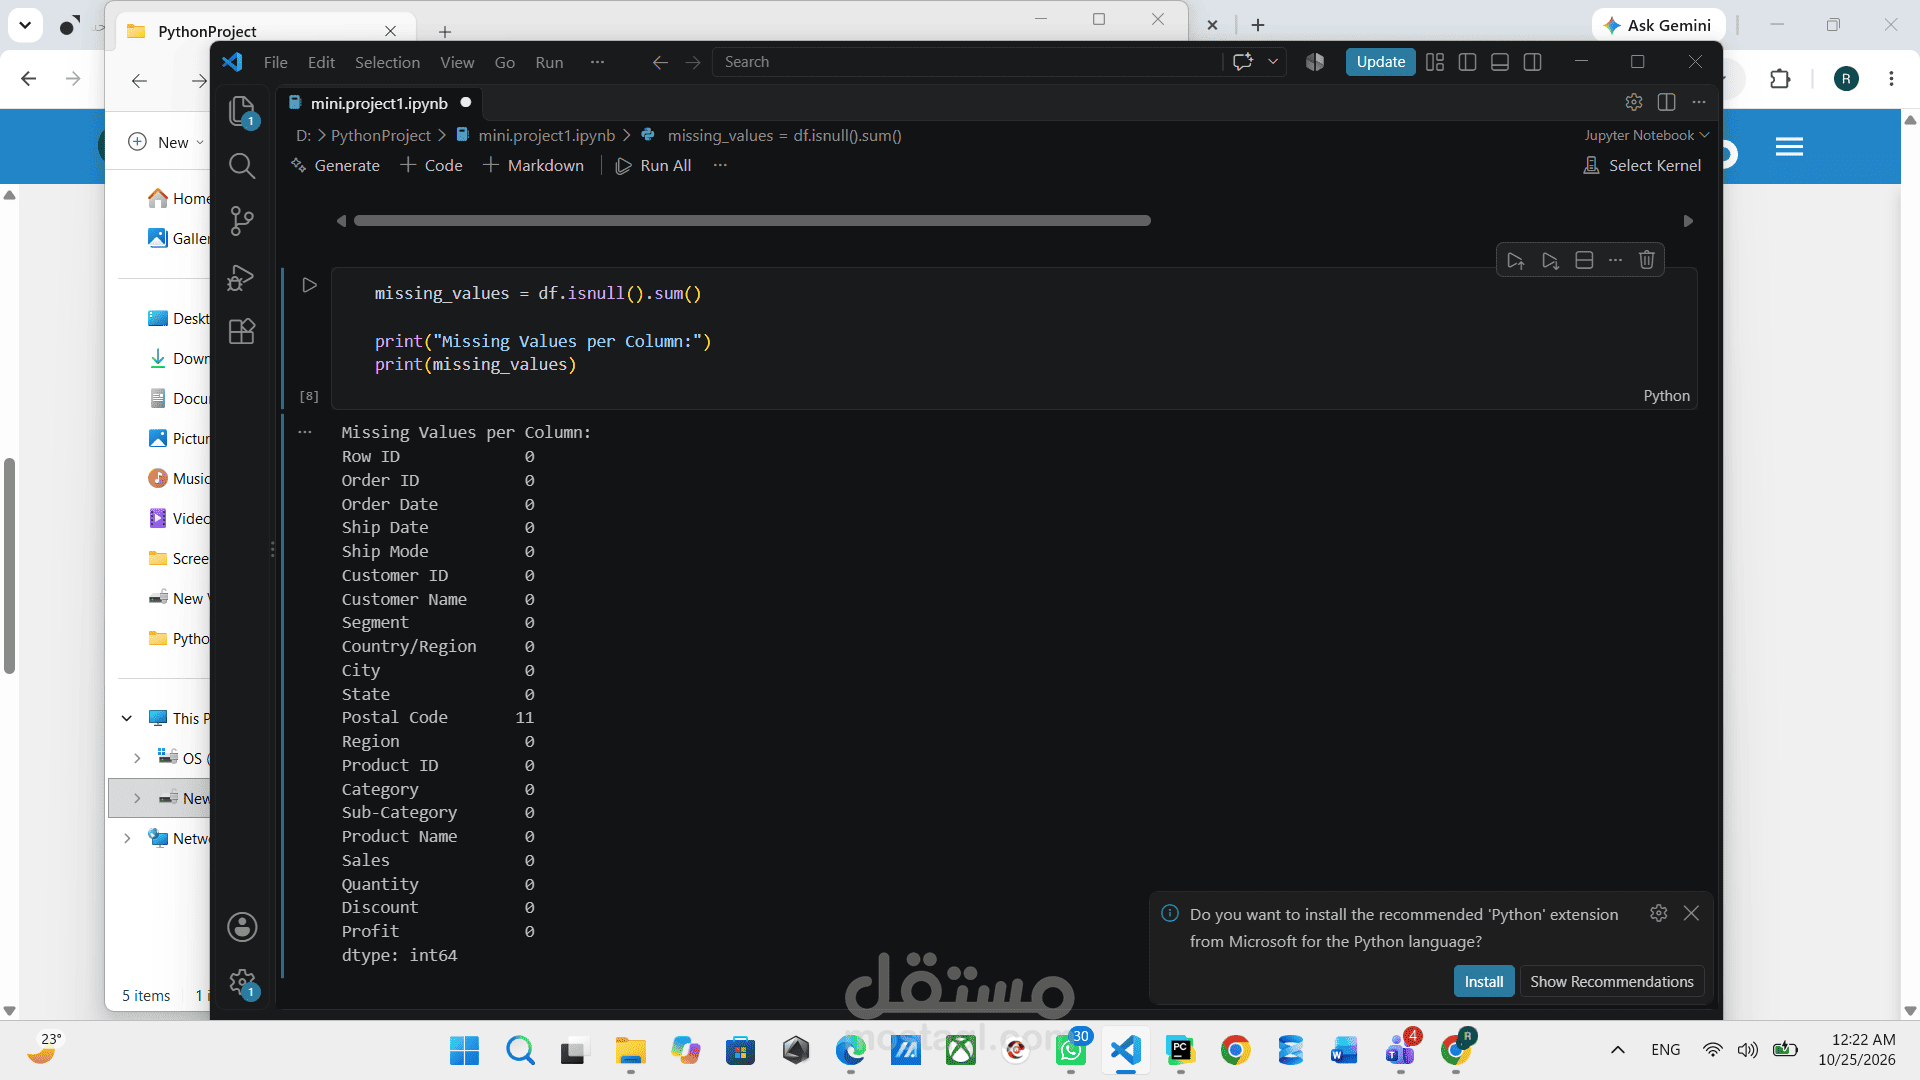
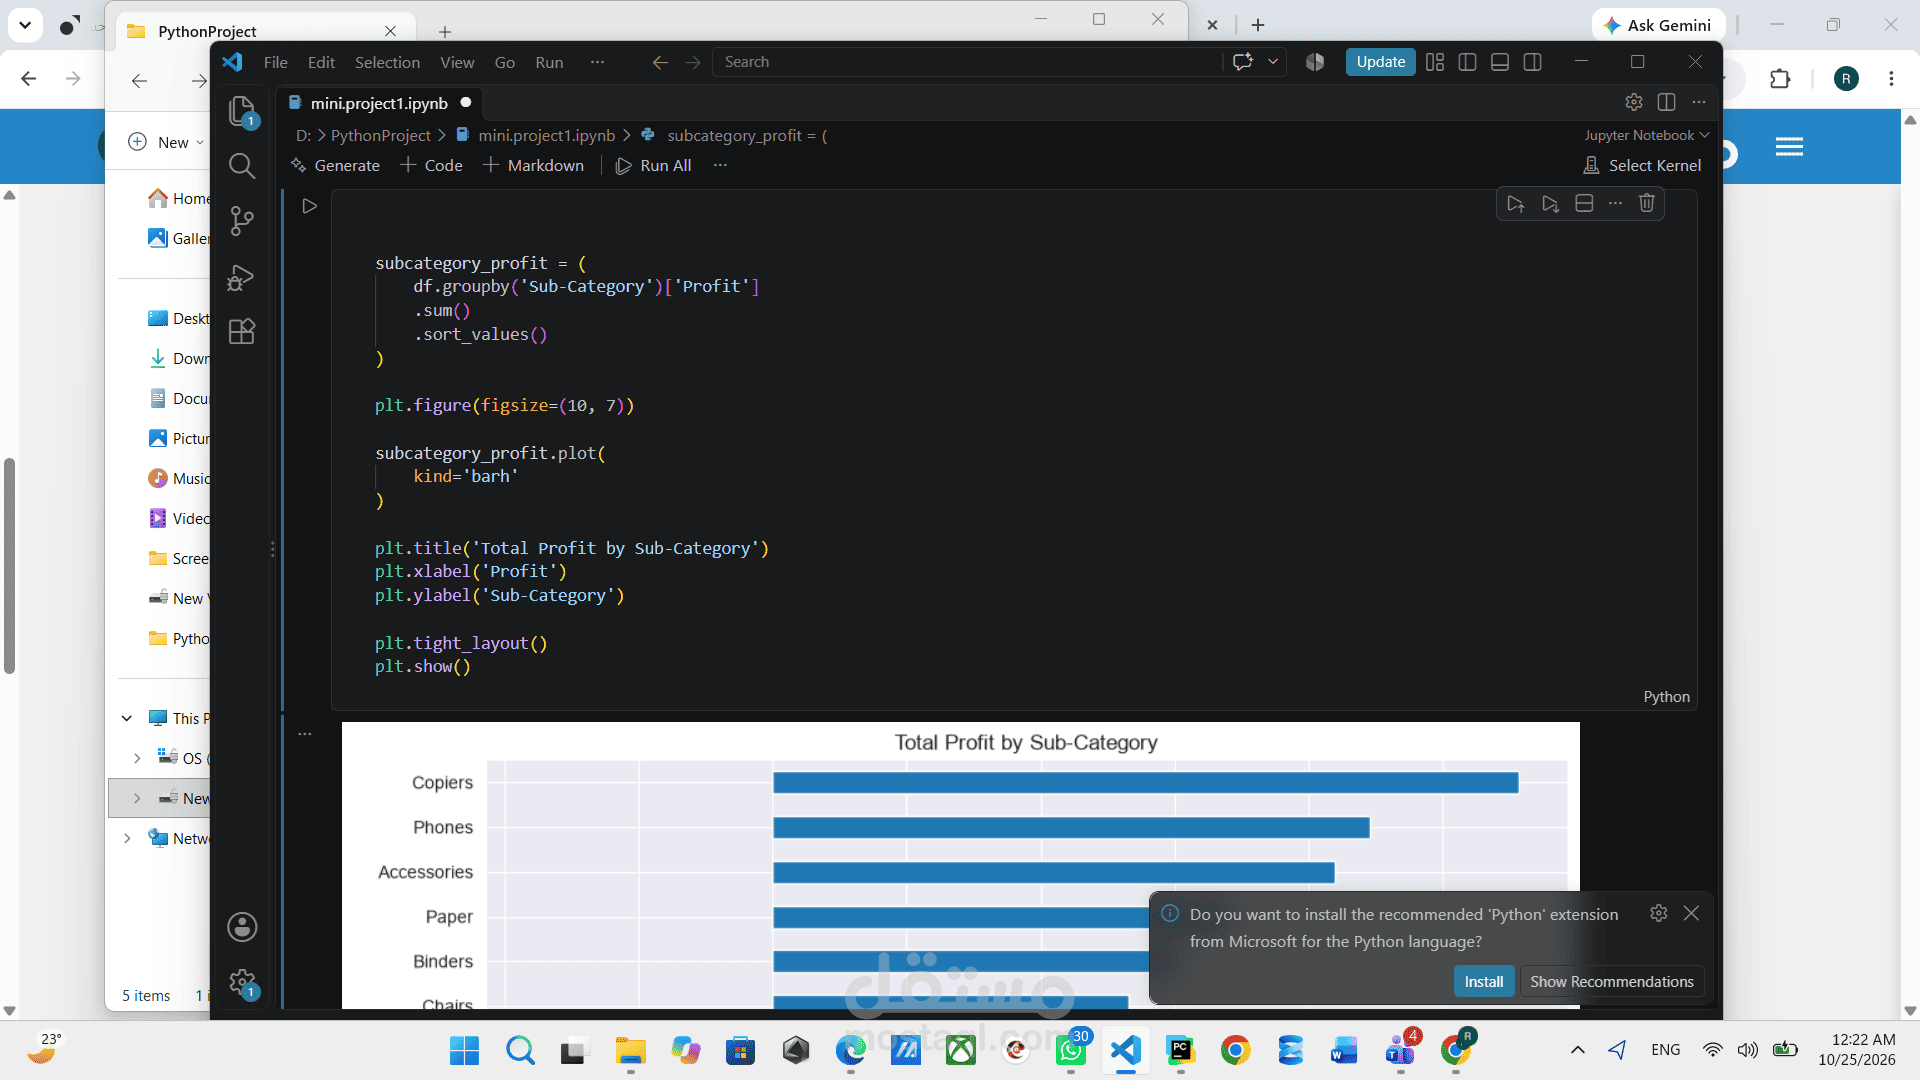
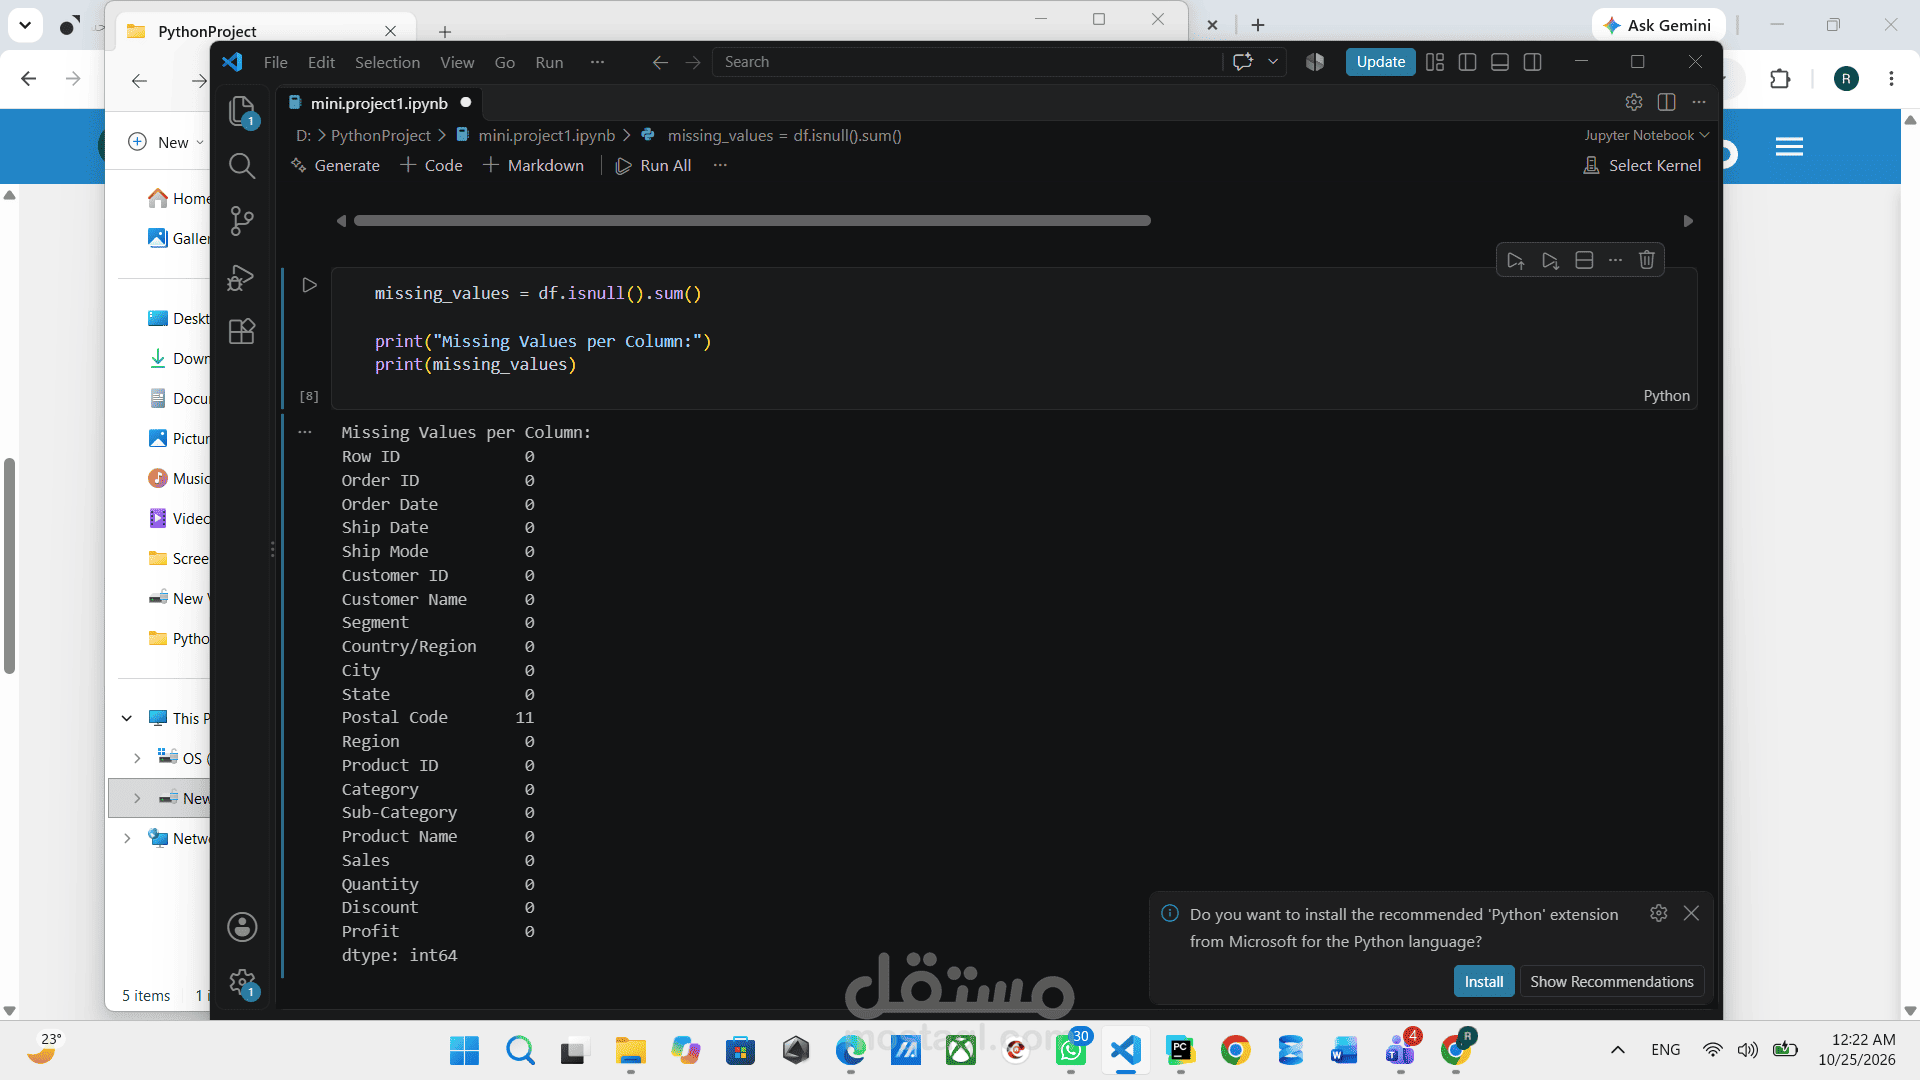
I developed a data analysis project using Python to analyze sales data and gain meaningful business insights. I used Pandas to group and analyze data, calculate total profit across different product sub-categories, and sort the results to identify the most profitable products.
I also used Matplotlib to create visualizations, including bar charts, to present the results clearly and make comparisons easier. This project helped me practice data analysis, data manipulation, and data visualization while turning raw data into useful insights that can support better business decisions.
Tools & Skills:
* Python
* Pandas
* Matplotlib
* Data Analysis
* Data Visualization
* Profit Analysis and Reporting