Country Development & Economic Performance Analysis | Power BI Dashboard
تفاصيل العمل
Project Overview
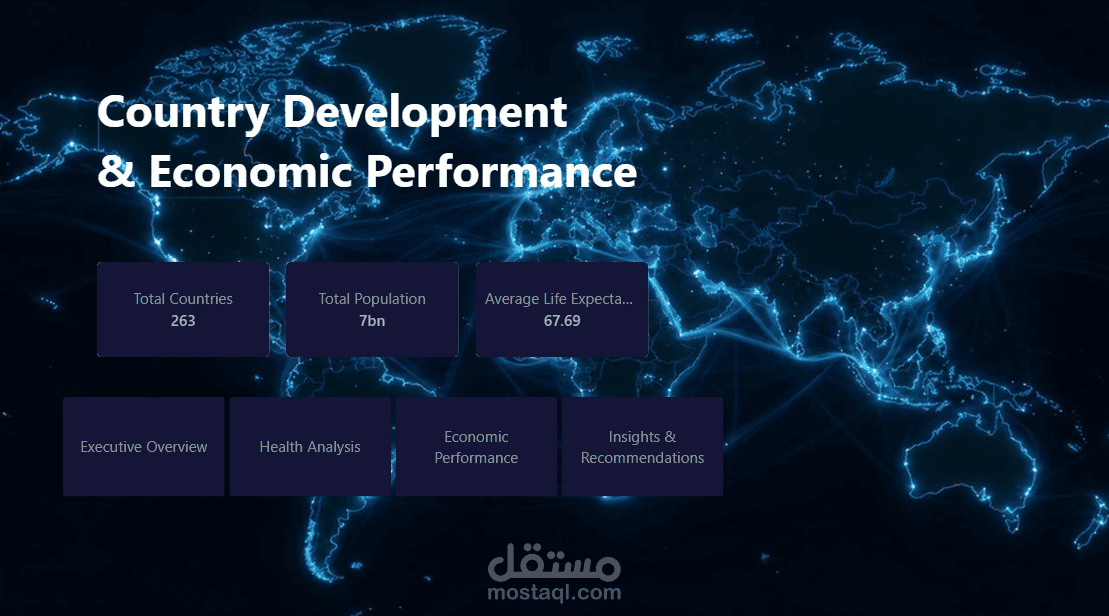
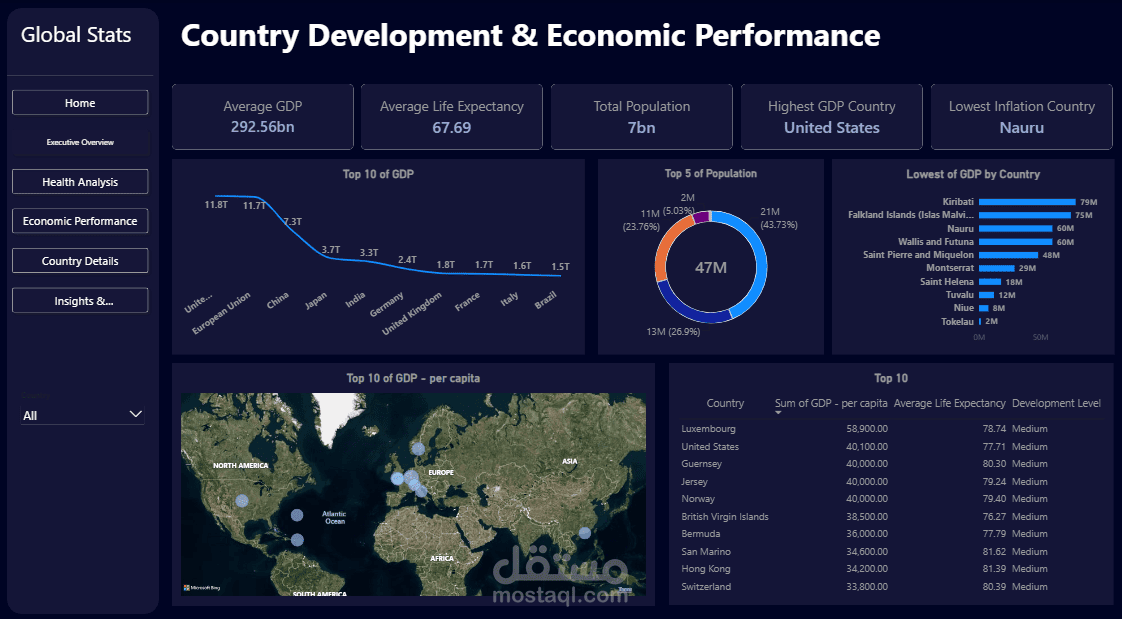
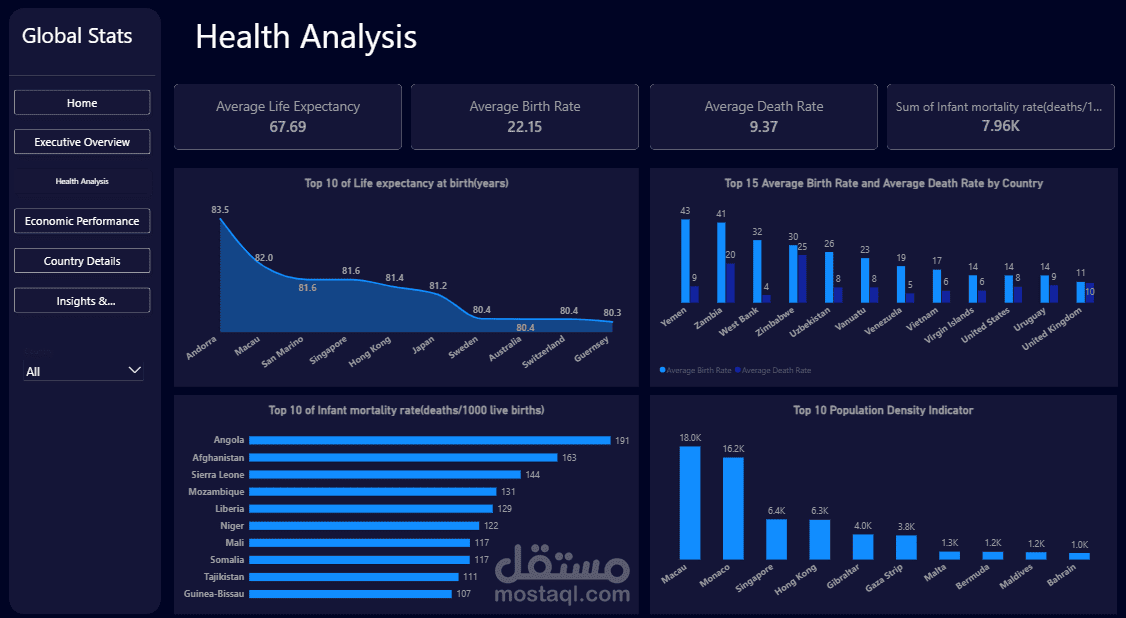
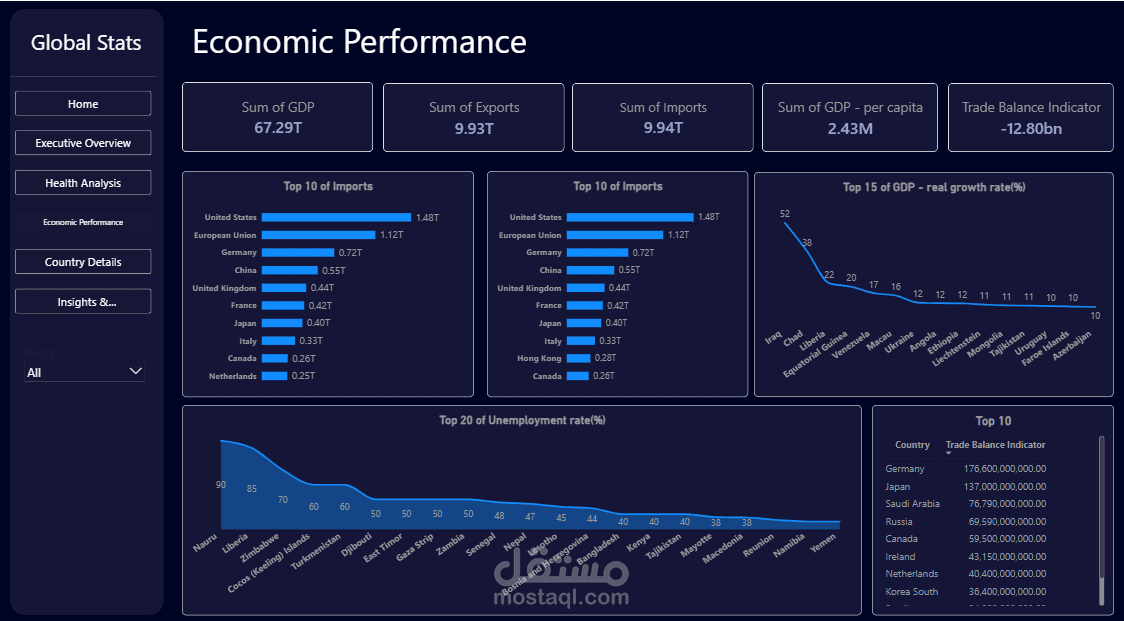
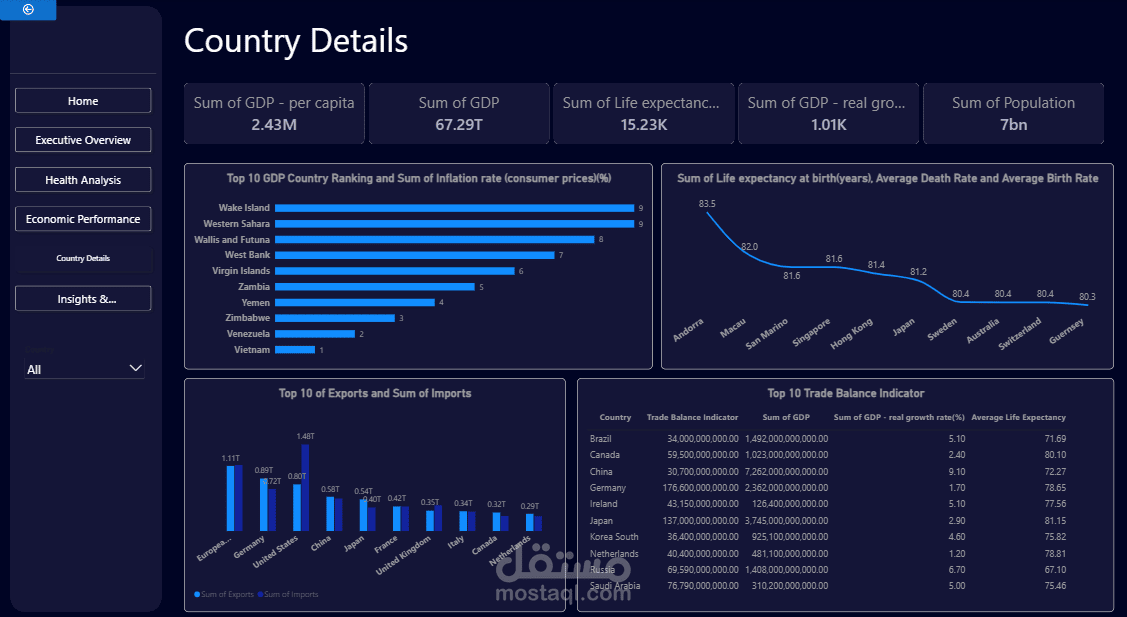
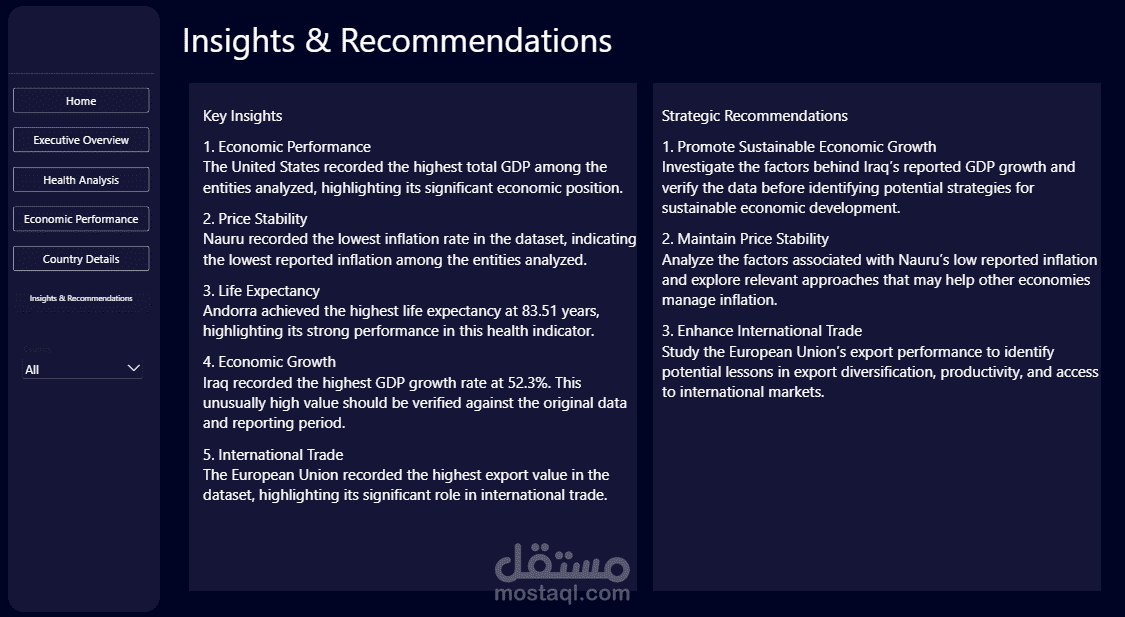
Developed an interactive Power BI dashboard to analyze country development and economic performance using socio-economic indicators from the Country Data Comparison dataset.
The project transforms raw country-level data into meaningful insights through interactive visualizations, KPI cards, geographical analysis, and DAX calculations.
Key Features
* Data cleaning and preparation using Power Query.
* Data modeling and organization of economic, health, trade, and population indicators.
* Interactive KPI cards for key development and economic metrics.
* Country comparison and ranking analysis.
* Geographical visualization using a world map.
* DAX measures for analyzing GDP, population, health indicators, and trade balance.
* Interactive filters and dynamic dashboard titles.
* Conditional formatting to highlight differences in performance.
* Multi-page dashboard design for executive reporting and detailed analysis.
Tools & Technologies
Microsoft Power BI, Power Query, DAX, Data Modeling, Data Visualization.
Project Objective
To provide a clear and interactive overview of economic performance and development indicators across countries, helping users compare key metrics, identify patterns, and explore differences in country-level performance.