Country Development & Economic Performance Analysis
تفاصيل العمل
Project Overview
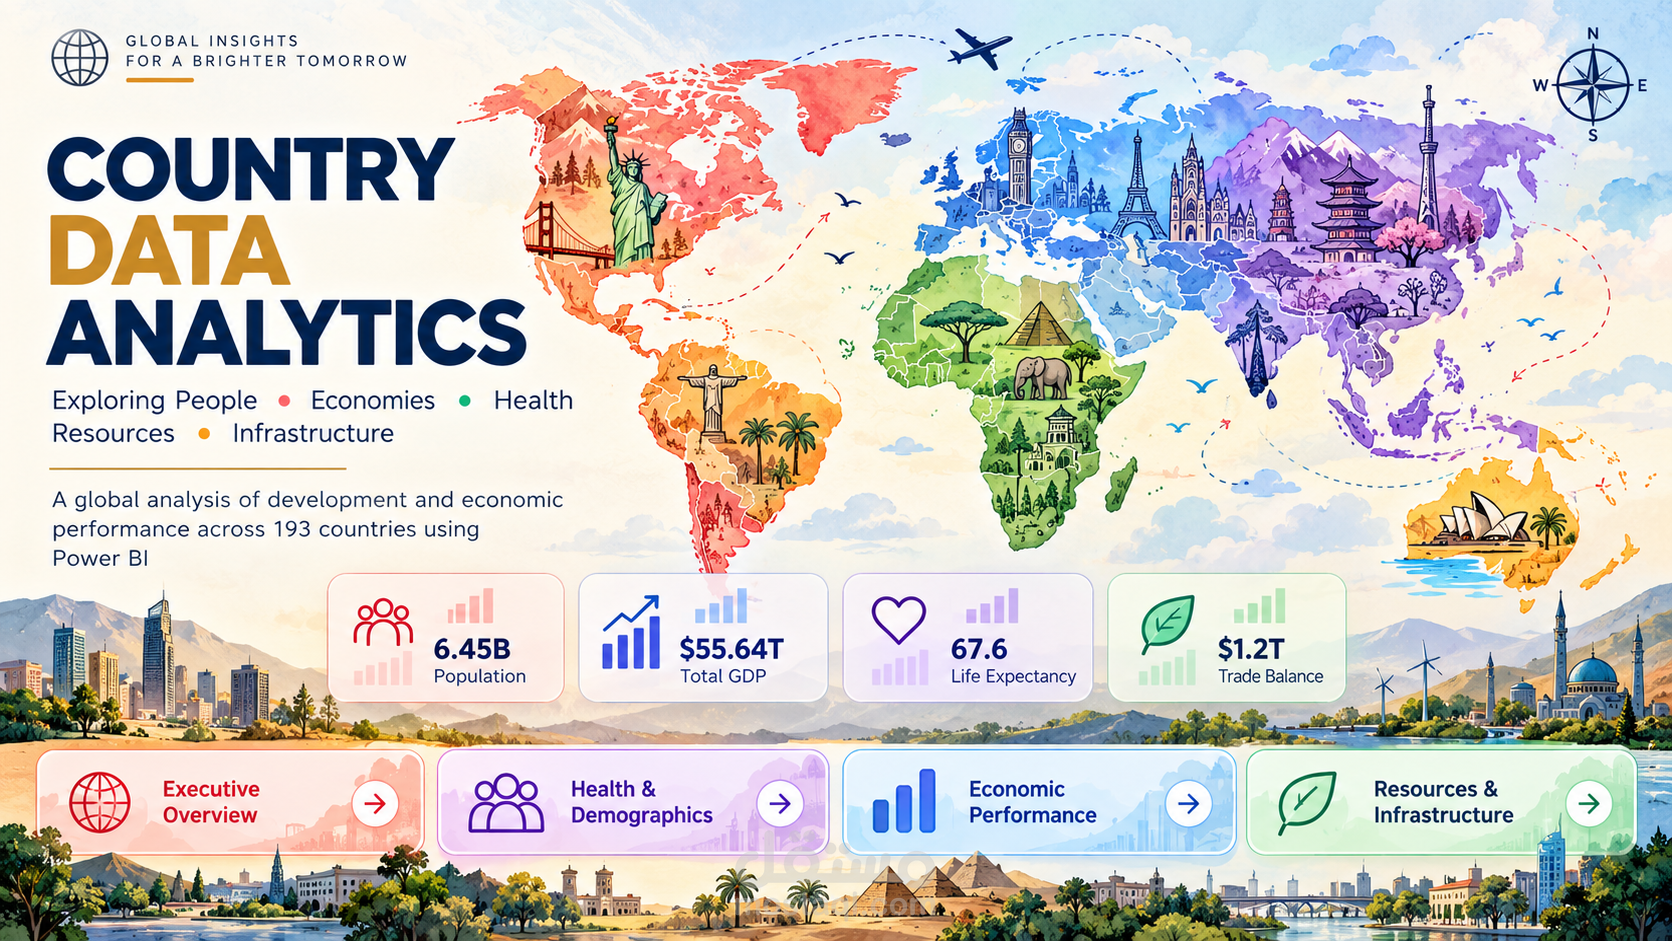
Developed an interactive Power BI dashboard to analyze global country development and economic performance using a country-level dataset based on the CIA World Factbook, 2005. The project transforms a wide dataset of international indicators into a structured analytical solution for comparing countries and regions across economic, demographic, health, trade, energy, external finance, military, and infrastructure domains.
Data Preparation & Power Query
Built a data preparation workflow using 14 Power Query queries to clean, standardize, and organize the source data. Calculated data coverage, excluded low-coverage entities using the project's 11.36% threshold, and retained 231 countries for the analytical population. Split the dataset into subject-specific domains so that missing values and country eligibility could be handled according to each domain's requirements.
Data Modeling
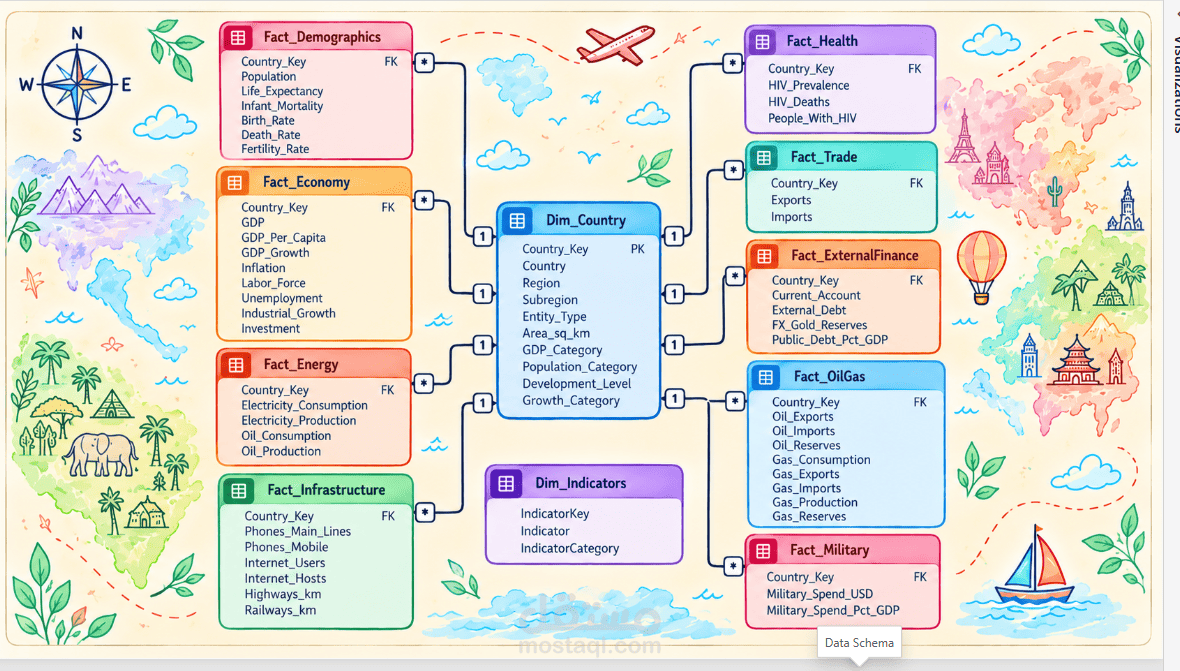
Designed a Power BI data model with a shared Dim_Country table, a Dim_Indicator lookup table, and 9 domain-specific fact tables:
• Fact_Economy
• Fact_Demographics
• Fact_Health
• Fact_Trade
• Fact_ExternalFinance
• Fact_Energy
• Fact_OilGas
• Fact_Millitary
• Fact_Infrastructure
Created country keys and one-to-many relationships between the country dimension and the fact tables. Applied domain-specific missing-value handling, including category-based average imputation in selected domains and source-guided zero replacements where specified.
DAX & Analytical Calculations
Developed a DAX layer documented with 52 measures and 14 calculated columns to support country comparisons, KPI calculations, rankings, economic grouping, and cross-domain analysis.
Dashboard Architecture — 4 Main Pages
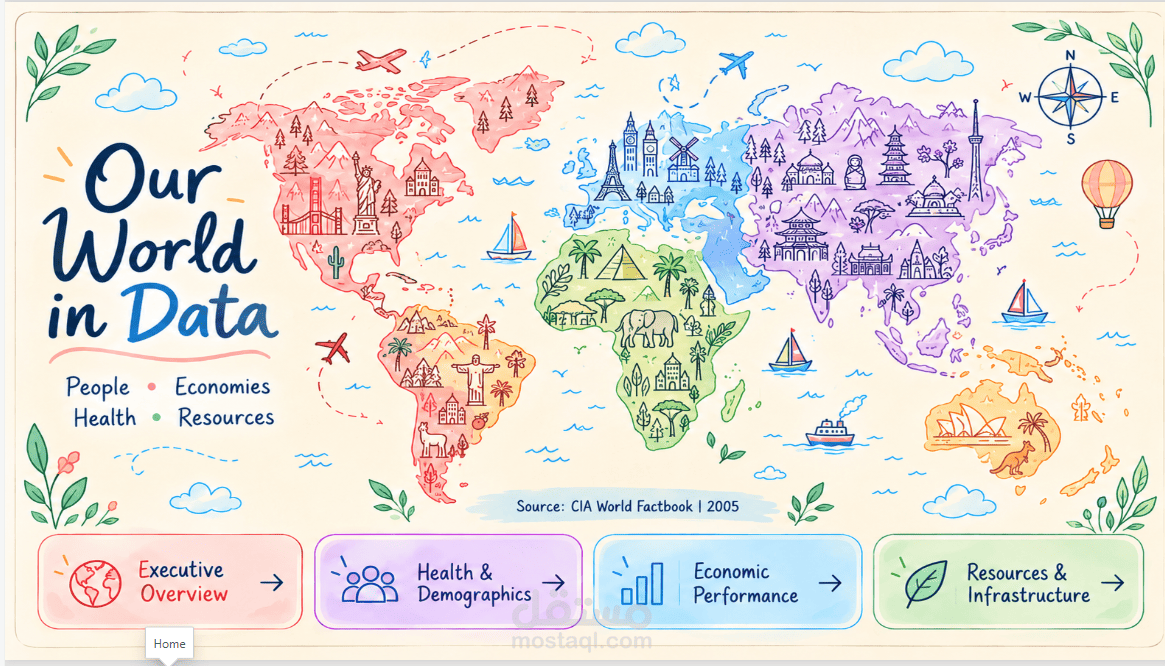
1. Home / Navigation: A visual landing page connecting users to the main analytical sections.
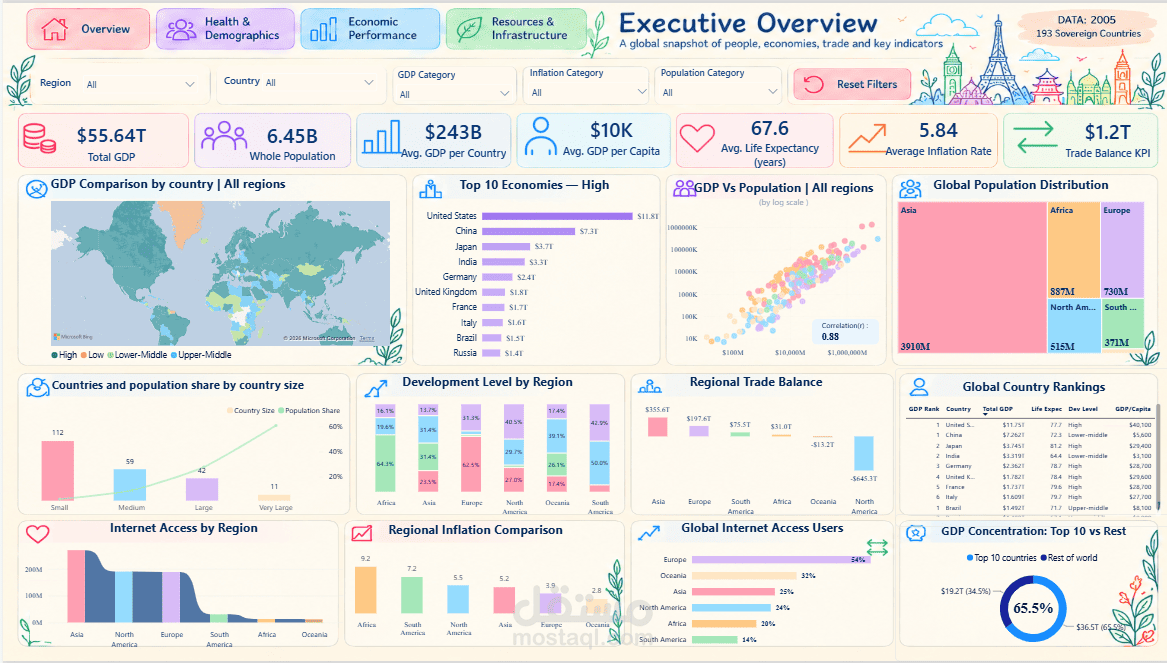
2. Executive Overview: A global summary of GDP, population, GDP per capita, life expectancy, inflation, and trade balance, supported by country comparisons, regional breakdowns, rankings, and geographical visuals.
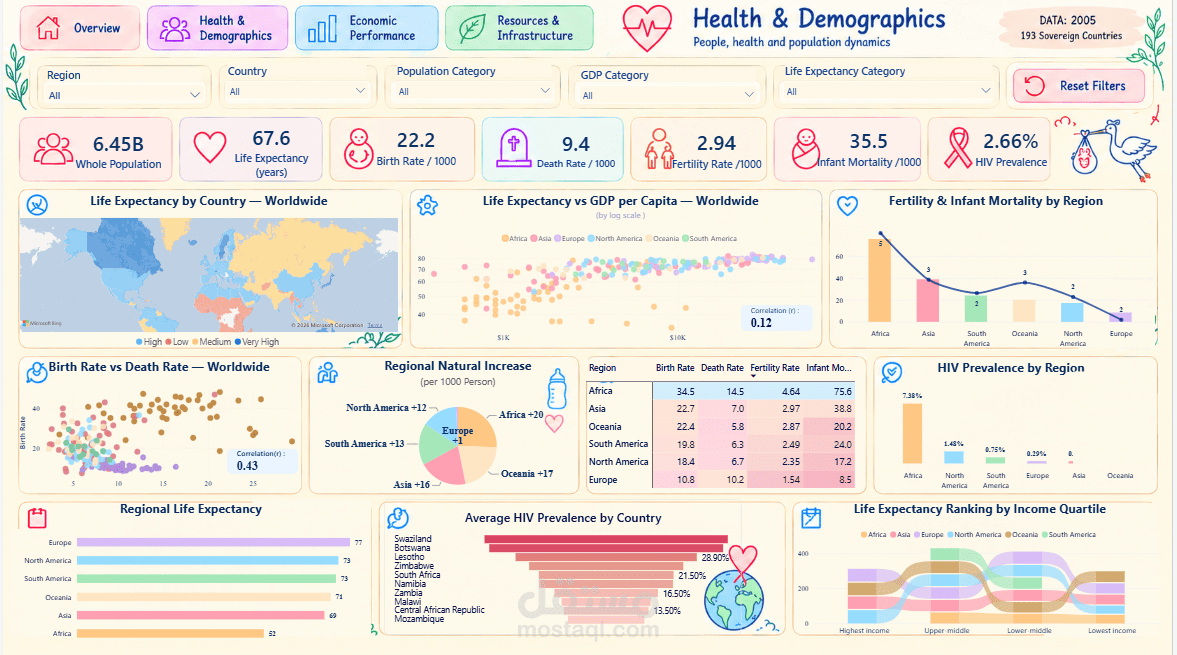
3. Health & Demographics: Analyzes life expectancy, birth and death rates, fertility, infant mortality, HIV indicators, and demographic differences across countries and regions.
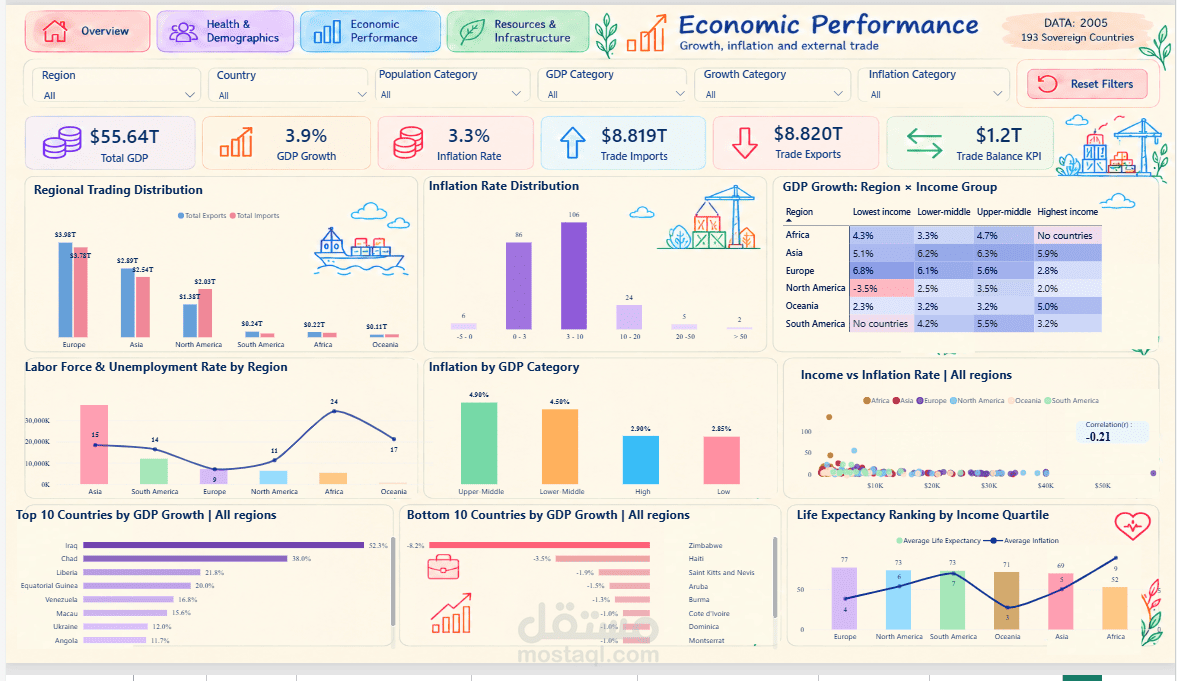
4. Economic Performance: Explores GDP growth, inflation, imports and exports, regional trade balances, labor force and unemployment, income-group comparisons, and country-level economic rankings.
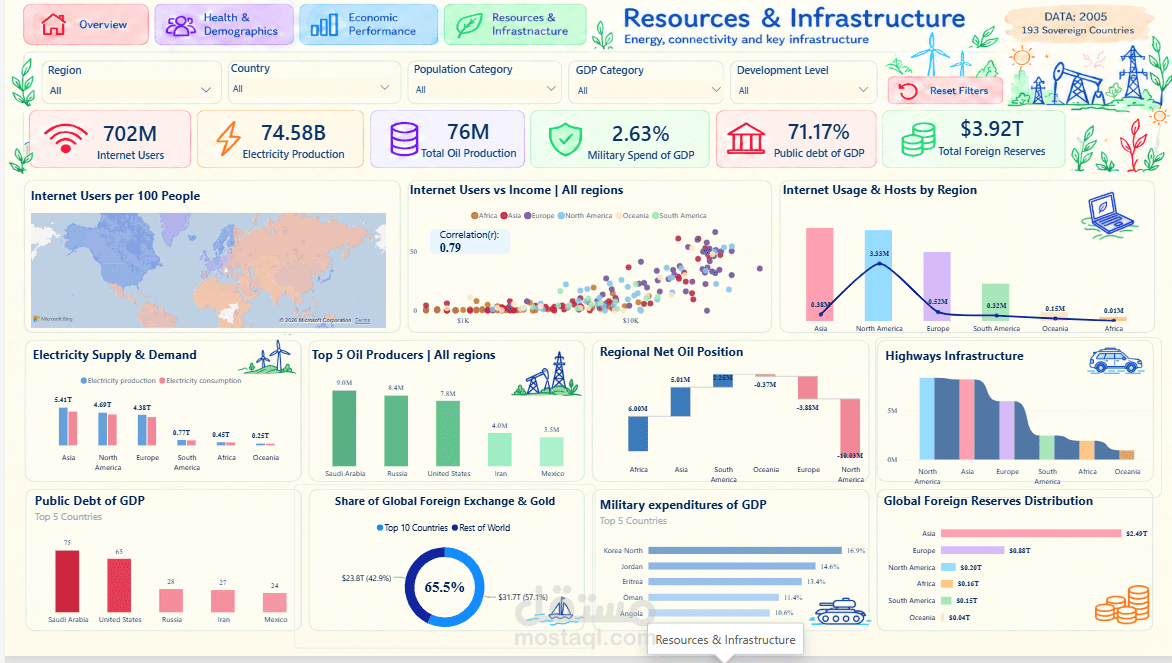
5. Resources & Infrastructure: Examines internet access, electricity, oil and gas, foreign reserves, public debt, military expenditure, and infrastructure indicators across regions.
Interactive Reporting & Regional Drill-Through
Designed interactive filters for dimensions such as region, country, GDP category, inflation category, population category, growth category, and development level, depending on the page.
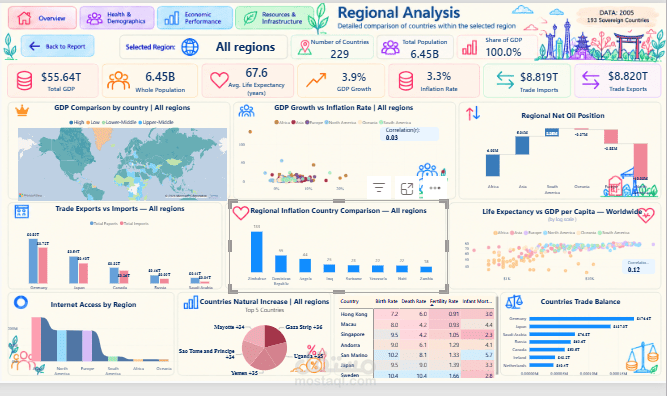
Added a Regional Analysis drill-through page to support deeper exploration of selected regional indicators and comparisons. The project documentation includes the page's visible controls, KPIs, charts, recommended drill-through field mapping, and implementation considerations.
Visual Design & Data Storytelling
Created a cohesive dashboard design with color-coded domain sections, KPI cards, country and regional comparisons, maps, scatter plots, bar charts, matrices, distribution charts, and other visuals selected according to the analytical question.
Tools & Technologies
Microsoft Power BI, Power Query, DAX, Data Modeling, Relationship Design, Missing-Value Handling, KPI Development, Interactive Filtering, Drill-Through Analysis, Geographical Visualization, and Data Storytelling.
Project Outcome
Delivered a multi-domain country analytics solution that organizes global indicators into a structured model and enables interactive exploration of development, health, economic performance, trade, resources, and infrastructure using a consistent reporting experience.