NEXORA SUPERSTORE | Interactive Power BI Sales Analytics Dashboard
تفاصيل العمل
Project Overview
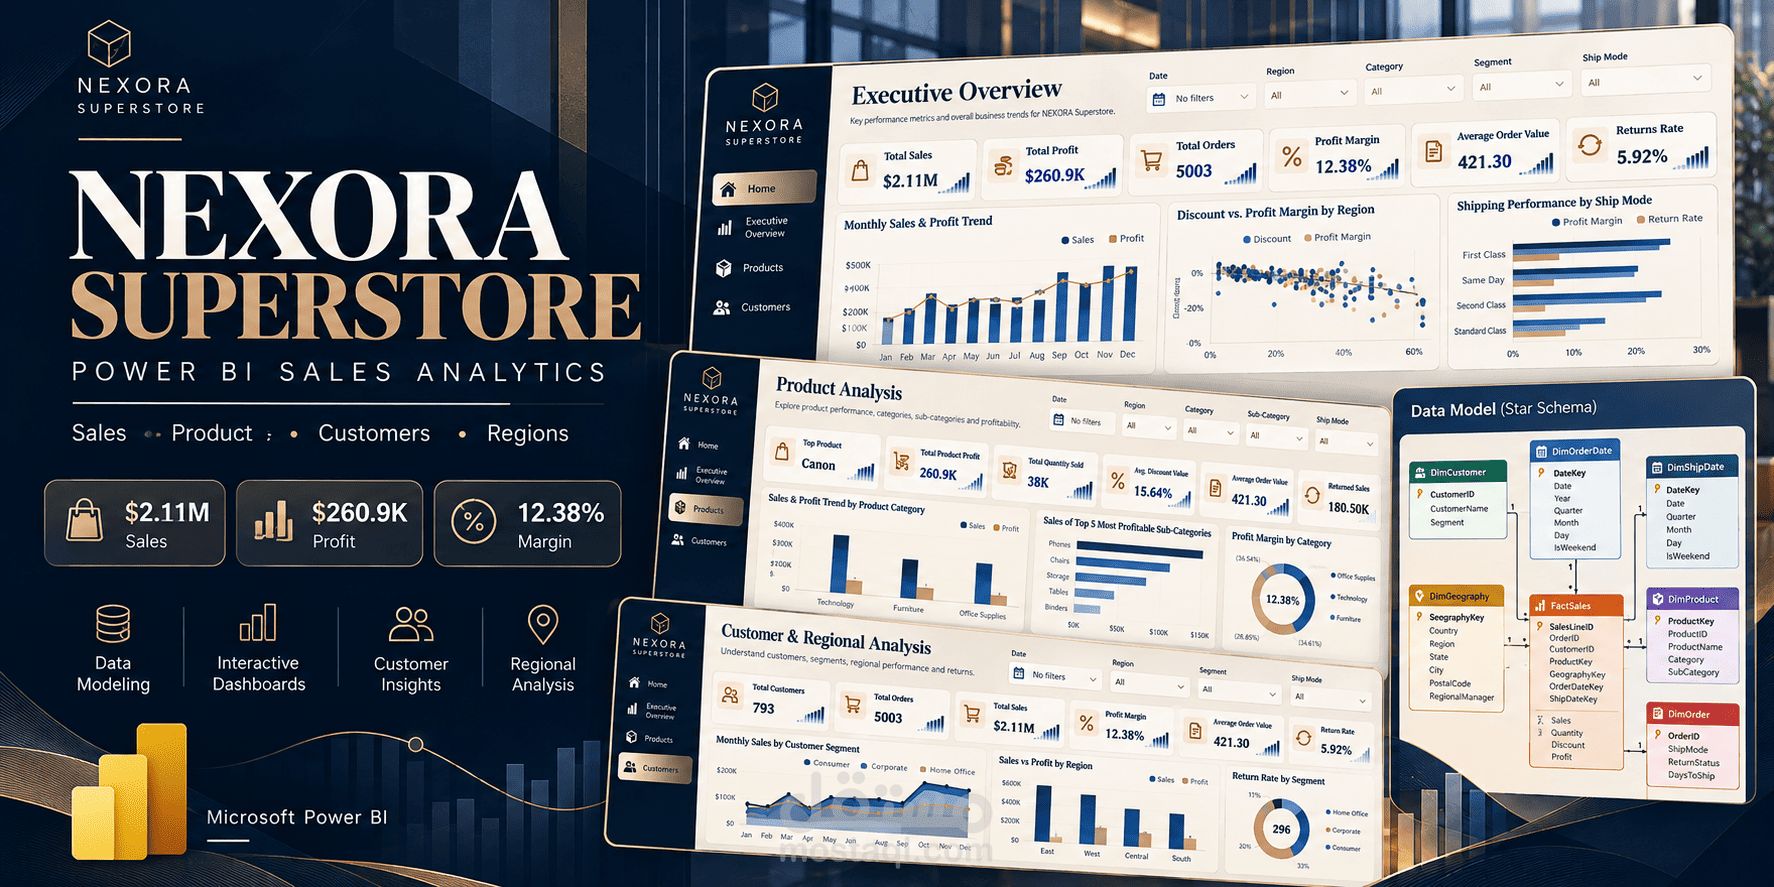
Developed NEXORA SUPERSTORE, an end-to-end Power BI analytics solution that transforms raw Superstore transaction data into a structured data model and an interactive, multi-page business intelligence report.
Data Profiling and Power Query
Started with the Orders, People, and Returns source tables. The original Orders table contained 9,994 order-line records.
Used Power Query to inspect data quality, standardize data types, clean text fields, remove unnecessary columns, create dimension tables, generate surrogate keys, merge regional manager information, process return records, and prepare the central FactSales table.
Data Modeling and Star Schema
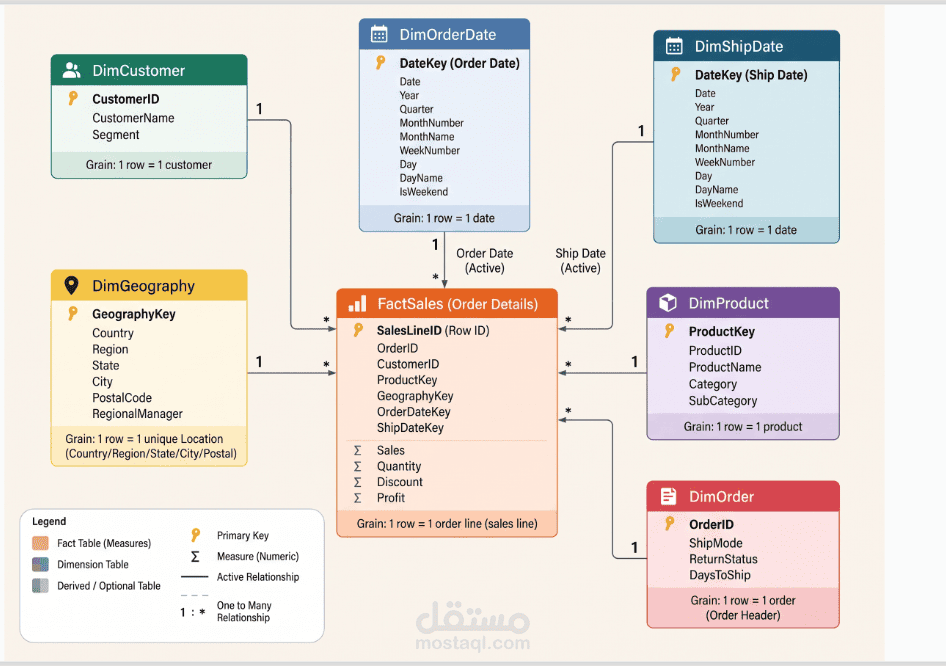
Designed a Star Schema with one central fact table, FactSales, and six dimension tables: DimOrder, DimCustomer, DimProduct, DimGeography, DimOrderDate, and DimShipDate.
Maintained a grain of one row per sales order line and established single-direction, one-to-many relationships between the fact and dimension tables.
Created separate order-date and ship-date dimensions with active relationships. Used ProductKey and GeographyKey to support reliable product and geographic identification.
Calculated Columns and DAX
Created two calculated columns: Profitability Category, which classifies sales lines as Loss, Break-even, or Profitable, and Shipping Delay, which groups delivery duration into Fast, Normal, and Delayed.
Developed DAX measures for core KPIs, returns, year-over-year analysis, running totals, shipping performance, customer value, and unit profitability.
The measures include Total Sales, Total Profit, Total Quantity, Orders, Customers, Profit Margin, Average Order Value, Average Discount, Returned Orders, Return Rate, Returned Sales, Returned Profit, previous-year metrics, YoY calculations, Running Total Sales, Average Days to Ship, Profit per Order, Profit per Customer, Sales per Customer, and Profit per Unit.
Four Main Dashboard Pages
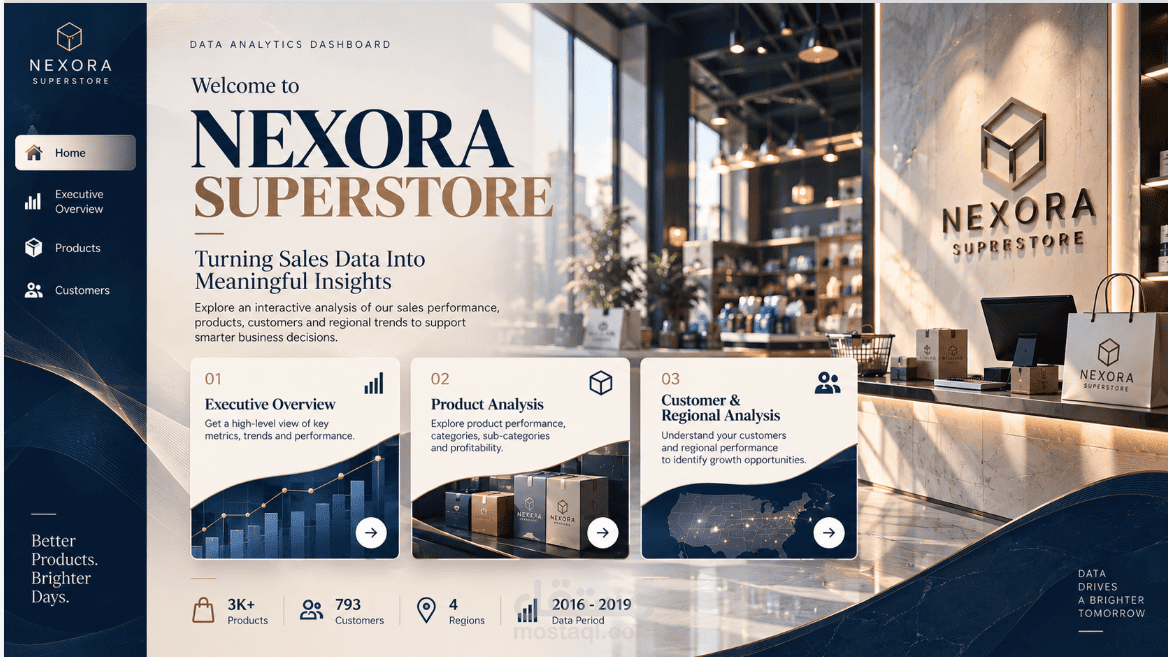
Page 1: Home and Navigation
Created a branded landing page introducing the NEXORA SUPERSTORE identity and providing navigation to the three analytical sections.
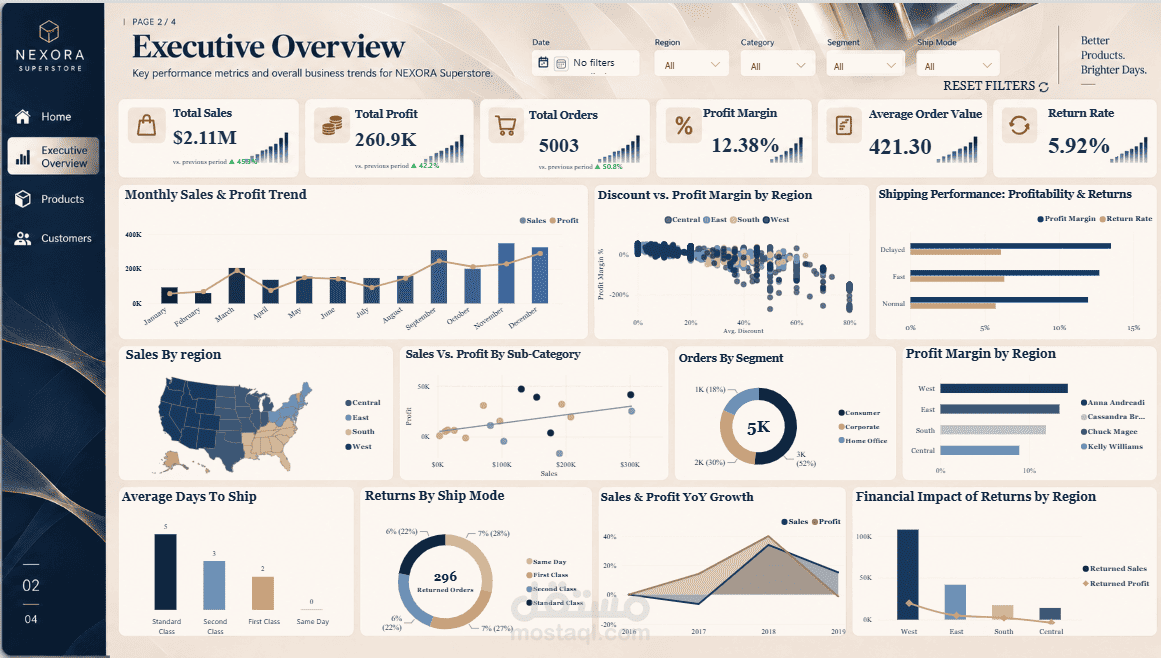
Page 2: Executive Overview
Designed an executive reporting page with 6 KPI cards: Total Sales, Total Profit, Total Orders, Profit Margin, Average Order Value, and Return Rate.
The page analyzes monthly performance, regional results, discount patterns, customer segments, shipping performance, returns, and year-over-year trends.
Added interactive filters for Date, Region, Category, Segment, and Ship Mode.
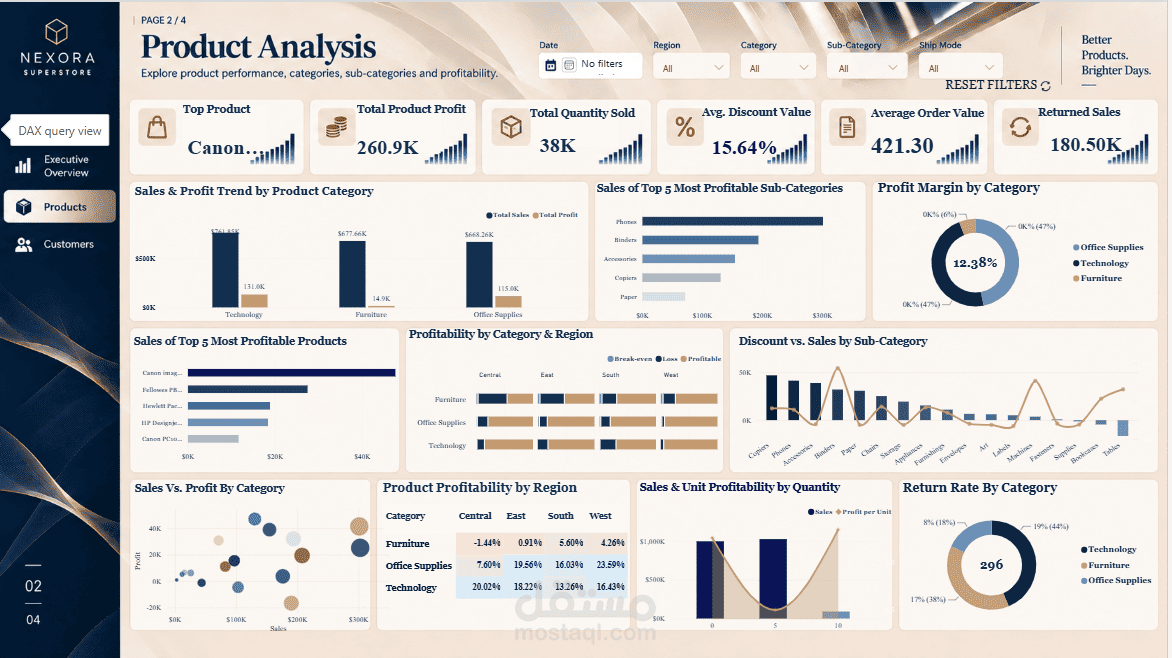
Page 3: Product Analysis
Designed a product-focused page with 5 KPI cards covering Top Product, Average Discount, Returned Sales, Average Order Value, and Total Profit.
The analysis includes sales and profit by category, profitable sub-categories, product performance, discount relationships, profit margins, quantity, and unit profitability.
Added filters for Date, Region, Category, Sub-Category, and Ship Mode.
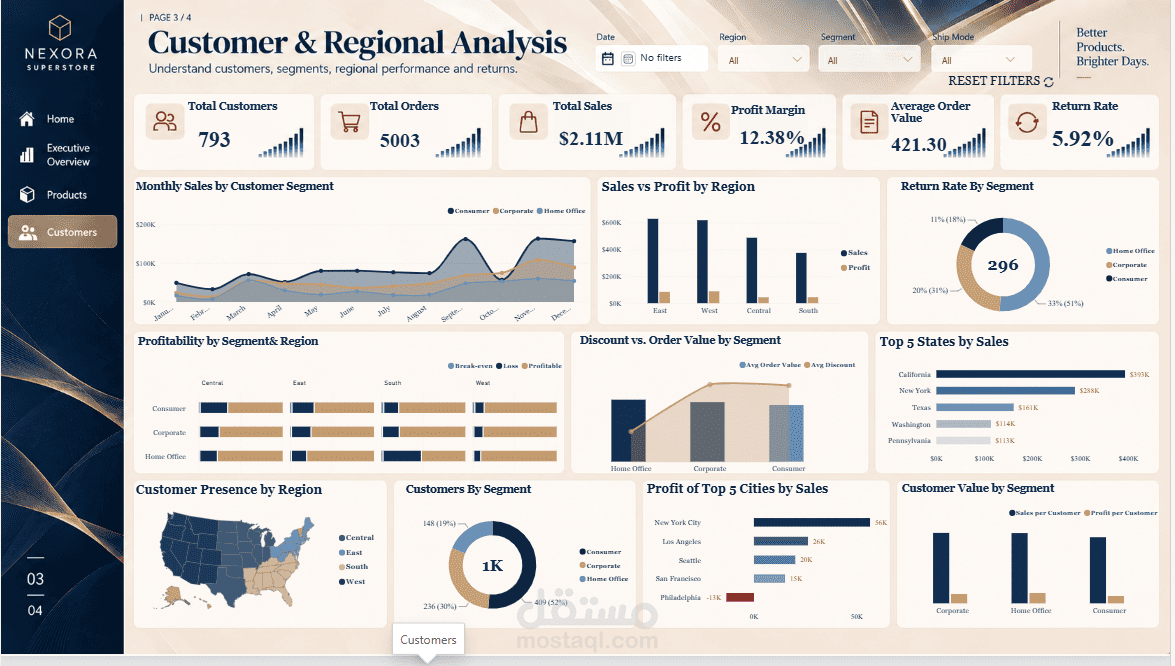
Page 4: Customer and Regional Analysis
Created a customer-focused page with 5 KPI cards: Customers, Orders, Average Order Value, Profit Margin, and Return Rate.
The page explores customer segments, regional performance, states and cities, customer value, profitability, discounts, shipping, and returns.
Added filters for Date, Region, Segment, and Ship Mode.
Three Dynamic Drill-Through Pages
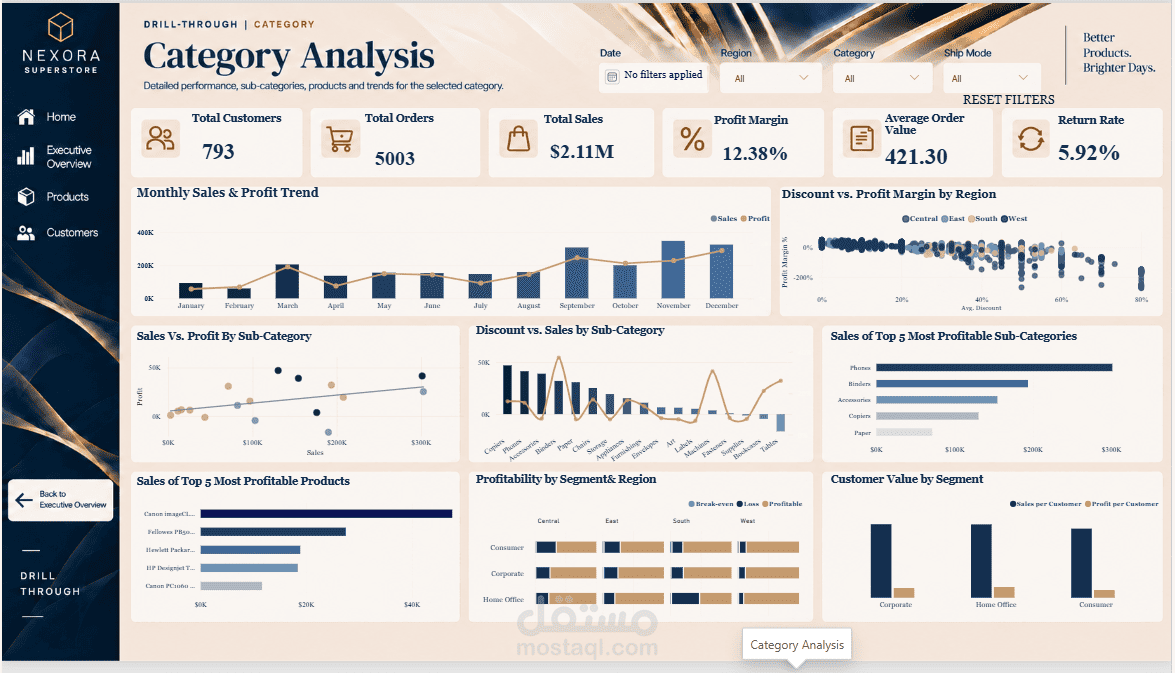
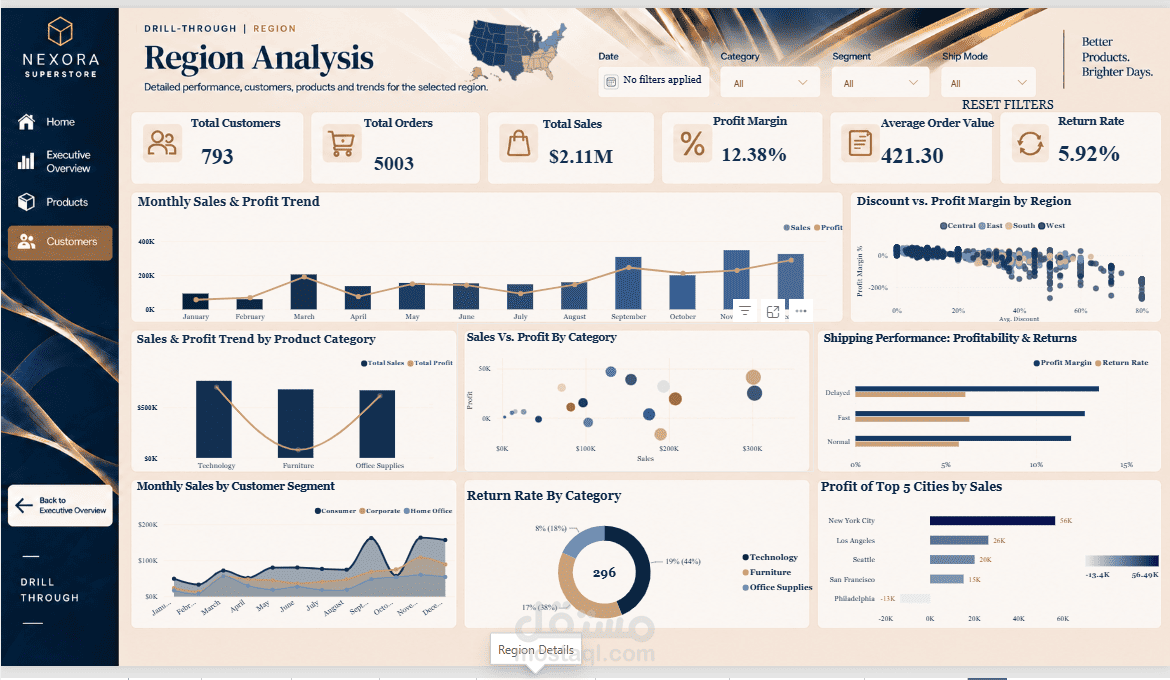
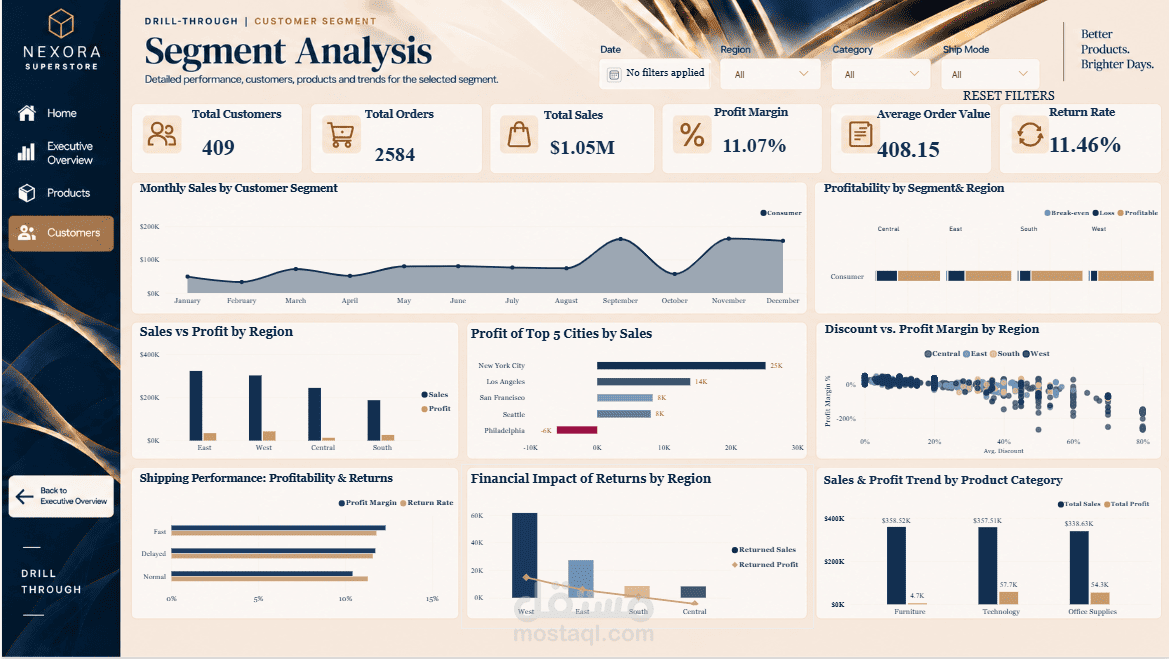
Implemented 3 additional drill-through pages, bringing the report to 7 pages in total. Each page uses the selected business dimension as its filter context, updates the visuals dynamically, follows the same design system, and includes a Back button.
Region Analysis: Examines the selected region through monthly sales and profit trends, category performance, discount and profitability patterns, shipping, returns, customer segments, and the top 5 cities by sales.
Segment Analysis: Analyzes the selected customer segment across regional profitability, monthly sales, category performance, city results, discounting, shipping, and returned sales and profit.
Category Analysis: Explores the selected product category through sub-category performance, profitable products, discount relationships, regional profitability, and customer value by segment.
Visual Design and Interactivity
Established a consistent NEXORA design system using navy, cream, bronze, green, and blue. Applied a consistent sidebar, navigation, KPI-card layout, typography, filters, and visual styling across the main report and drill-through pages.
Used a variety of visuals, including line charts, column charts, combo charts, bar charts, donut charts, scatter plots, maps, tables, and matrices to address different business questions.
Tools Used
Microsoft Power BI, Power Query, DAX, Star Schema Data Modeling, Surrogate Keys, Dimensional Modeling, Time Intelligence, KPI Design, Interactive Slicers, Drill-Through Reporting, and Data Visualization.
Project Outcome
Delivered a complete Power BI analytics solution combining data preparation, dimensional modeling, reusable DAX calculations, executive reporting, product analysis, customer and regional analysis, and dynamic drill-through exploration in one cohesive reporting experience.