data analyst by excel
تفاصيل العمل
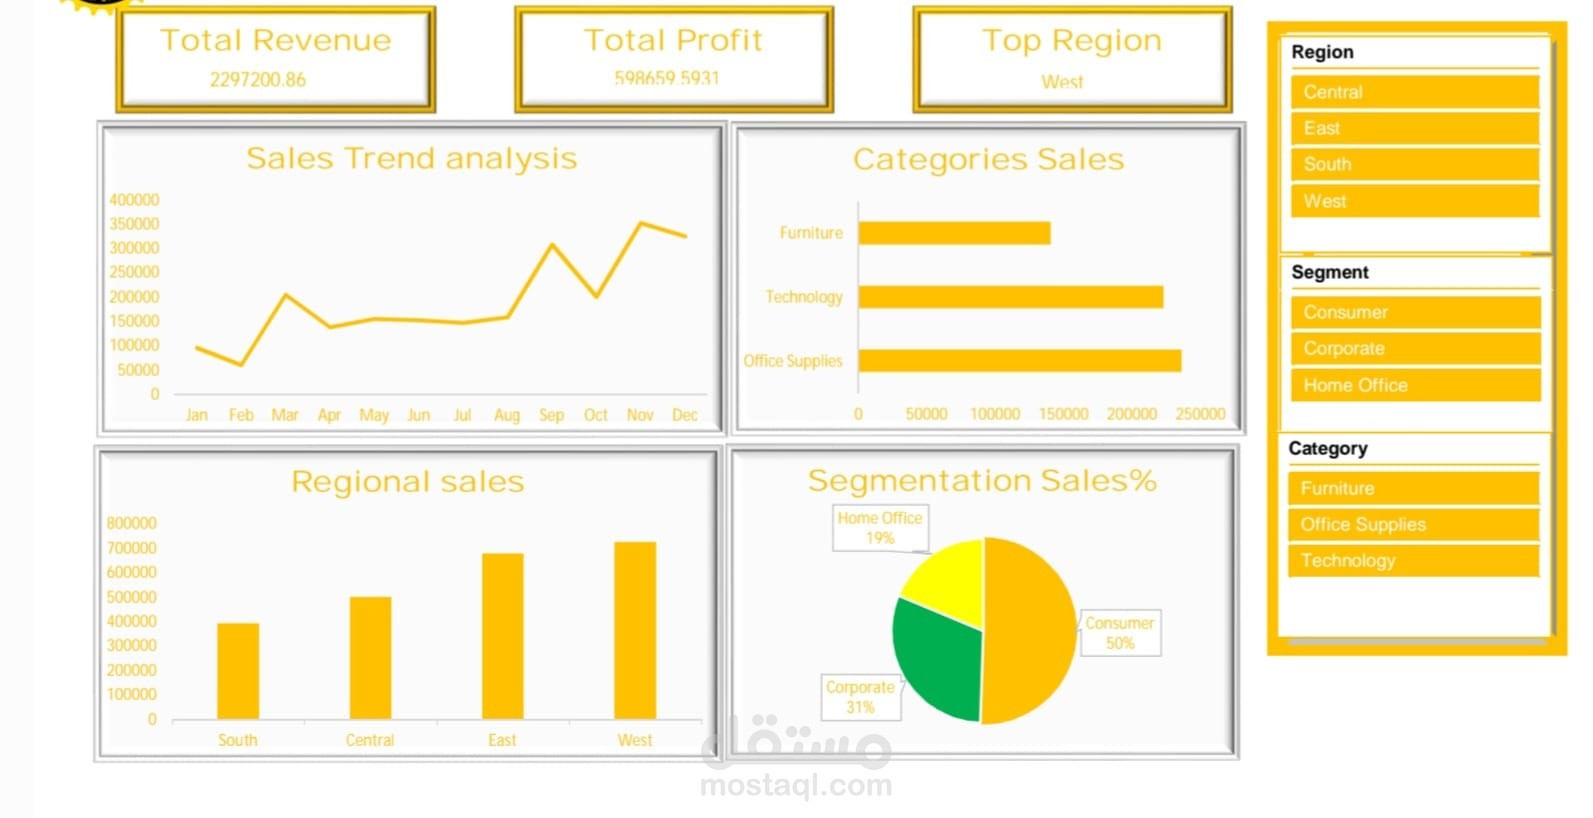
In this project, I took raw datasets and transformed them into an interactive dashboard designed to drive strategic, data-driven decisions. The project lifecycle included the following key phases:
Data Cleaning & Preparation: Utilized Power Query to clean and transform the raw data. This involved removing duplicates, handling missing values, and standardizing data types and formats to ensure the highest level of accuracy before analysis.
Data Modeling: Structured the dataset by designing a robust relational data model. I built Fact and Dimension tables and established the correct active relationships to ensure optimal performance and efficient reporting.
DAX Calculations: Authored custom DAX measures and calculated columns to extract precise Key Performance Indicators (KPIs) tailored to the business needs, including time-intelligence comparisons and growth metrics.
Dashboard Design & Visualization: Built a highly interactive and visually appealing dashboard using Power BI. I implemented intuitive charts, slicers, and drill-down capabilities, enabling the user to easily filter data and uncover the story behind the numbers.
The Outcome:
Delivered a dynamic, automated visual tool that significantly reduces the time spent on manual tracking, providing clear, actionable insights based on reliable data.