Interactive Tableau Dashboard for Iris Dataset
تفاصيل العمل
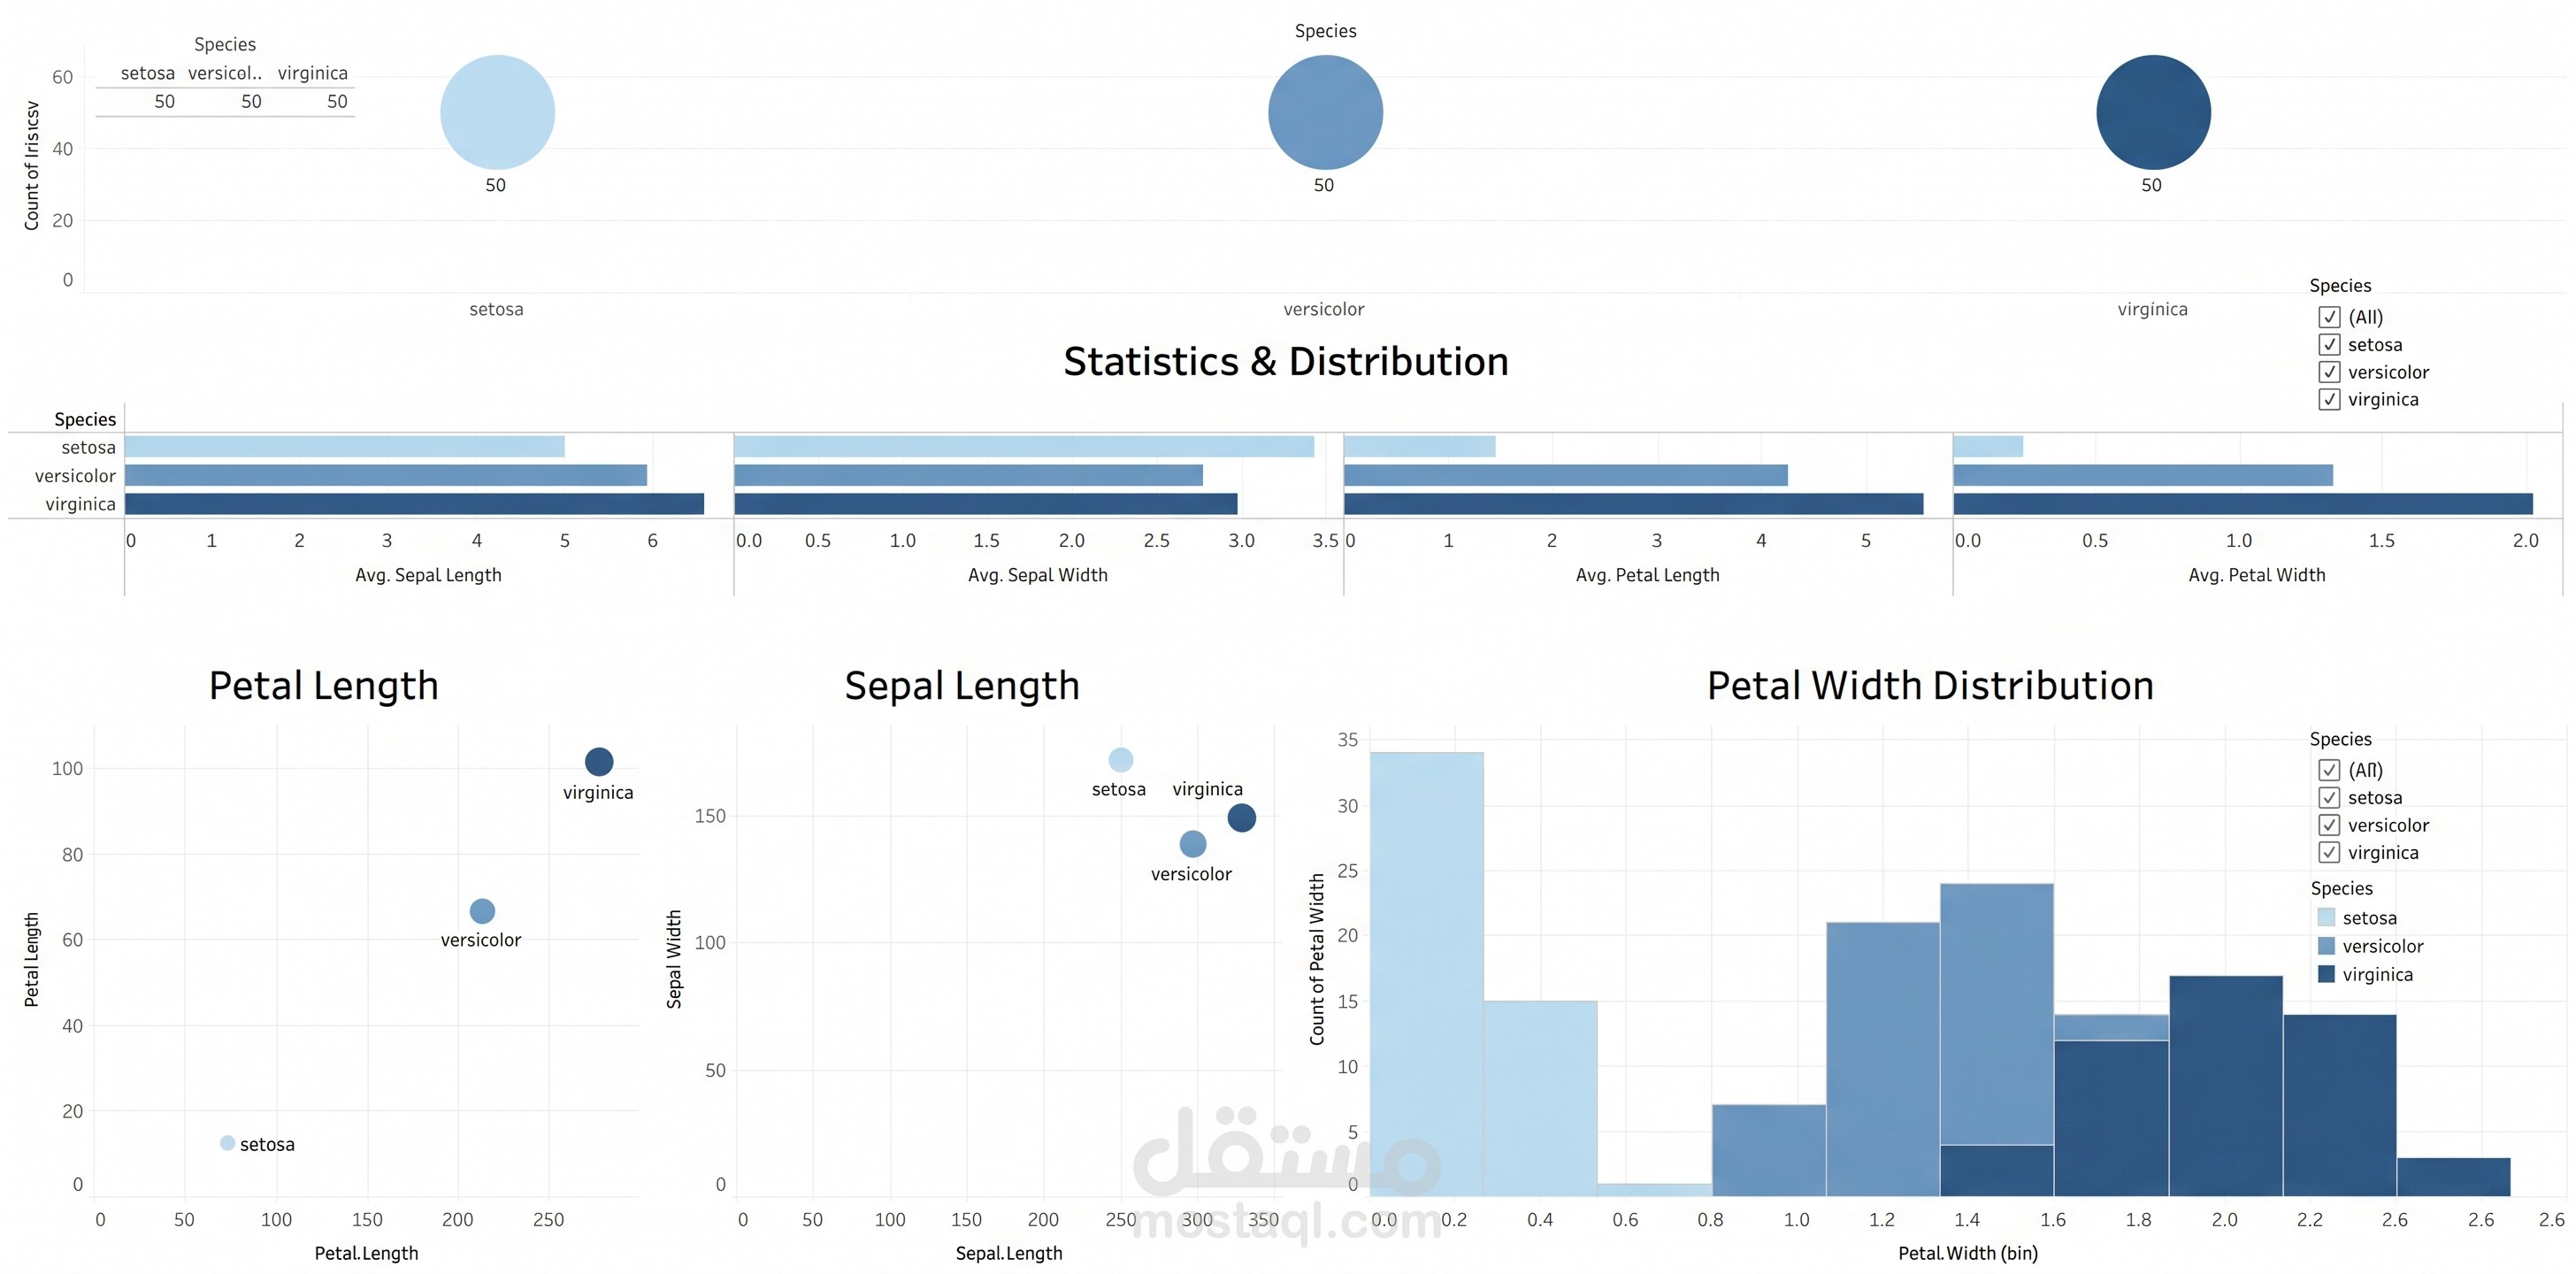
This project features a comprehensive Exploratory Data Analysis (EDA) dashboard developed in Tableau to visualize the physical characteristics of the Setosa, Versicolor, and Virginica Iris species. The dashboard includes visual KPI indicators for species sample counts, alongside comparative bar charts that break down average sepal and petal dimensions. It also leverages aggregate bubble plots and a stacked histogram for deeper distribution analysis of petal widths. Supported by interactive filters for dynamic data exploration, this project demonstrates proficiency in statistical analysis, data storytelling, and professional Tableau dashboard design