Global Economic and Unemployment Analysis Dashboard - Tableau
تفاصيل العمل
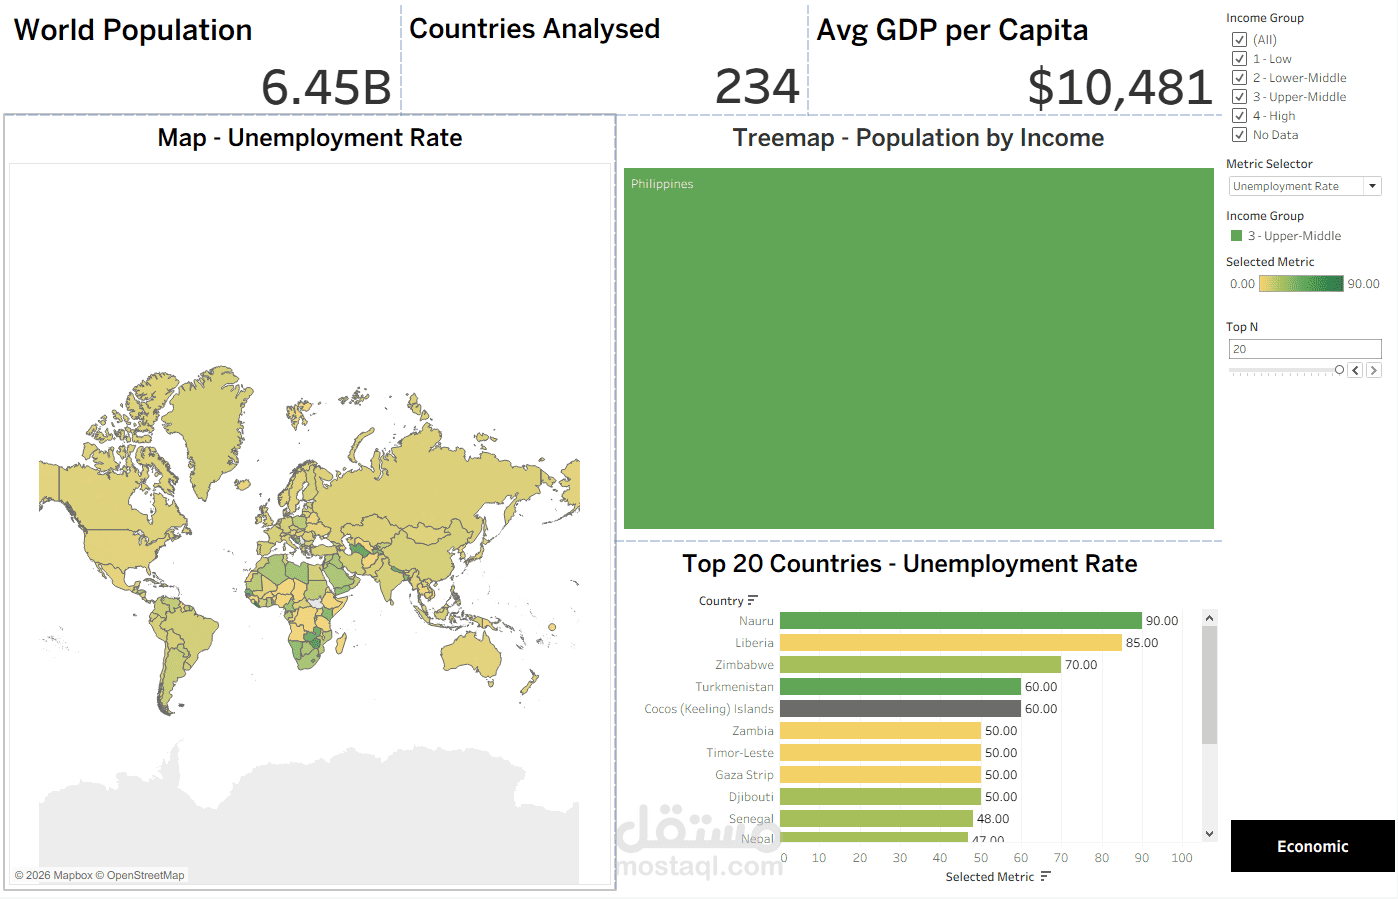
Global Economic and Unemployment Analysis Dashboard
This project features an interactive Tableau dashboard designed to analyze global population and economic indicators across countries. It provides an overview of key metrics, including total world population, the number of countries analyzed, and average GDP per capita.
The dashboard includes a geographical map to explore unemployment rates worldwide, a treemap to visualize population distribution by income group, and a bar chart highlighting the top 20 countries based on the selected indicator. Interactive filters allow users to explore different income groups, switch between analytical metrics, and adjust the number of countries displayed.
The main objective of this project is to transform global economic and demographic data into clear, meaningful visual insights that facilitate comparison between countries, reveal differences in unemployment rates, and support data-driven exploration.
The dashboard is designed for data analysts, researchers, students, economists, and decision-makers who need an accessible and interactive way to explore global economic and demographic trends.