Sales Data Analysis Dashboard Using Power BI
تفاصيل العمل
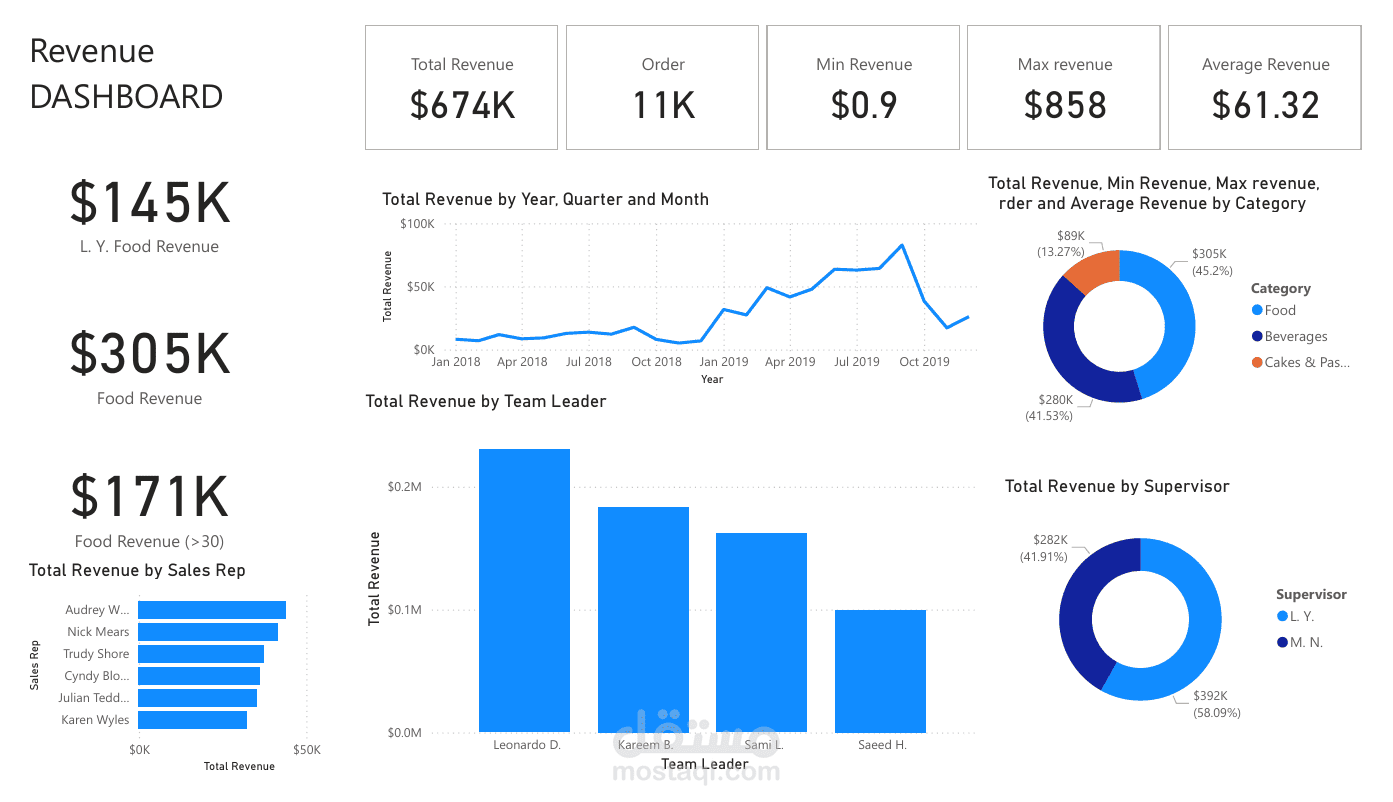
Sales Data Analysis Dashboard Using Power BI
I developed a sales analysis dashboard using Microsoft Power BI to visualize sales performance and help users understand business data through interactive reports.
The dashboard includes:
- Key performance indicators (KPIs), including total revenue, units sold, and order volume.
- Sales analysis by product, category, and region.
- Revenue breakdowns by sales representative, team leader, and supervisor.
- Monthly, quarterly, and yearly sales trends.
- Interactive visualizations to support data exploration and business reporting.
Tools & Skills: Microsoft Power BI, Data Visualization, Sales Analytics, KPI Reporting, Business Intelligence.
Project Objective:To transform sales data into clear and meaningful visual insights that support performance monitoring and business decision-making.