Credit Risk Dashboard – Credit Card Analytics | Power BI
تفاصيل العمل
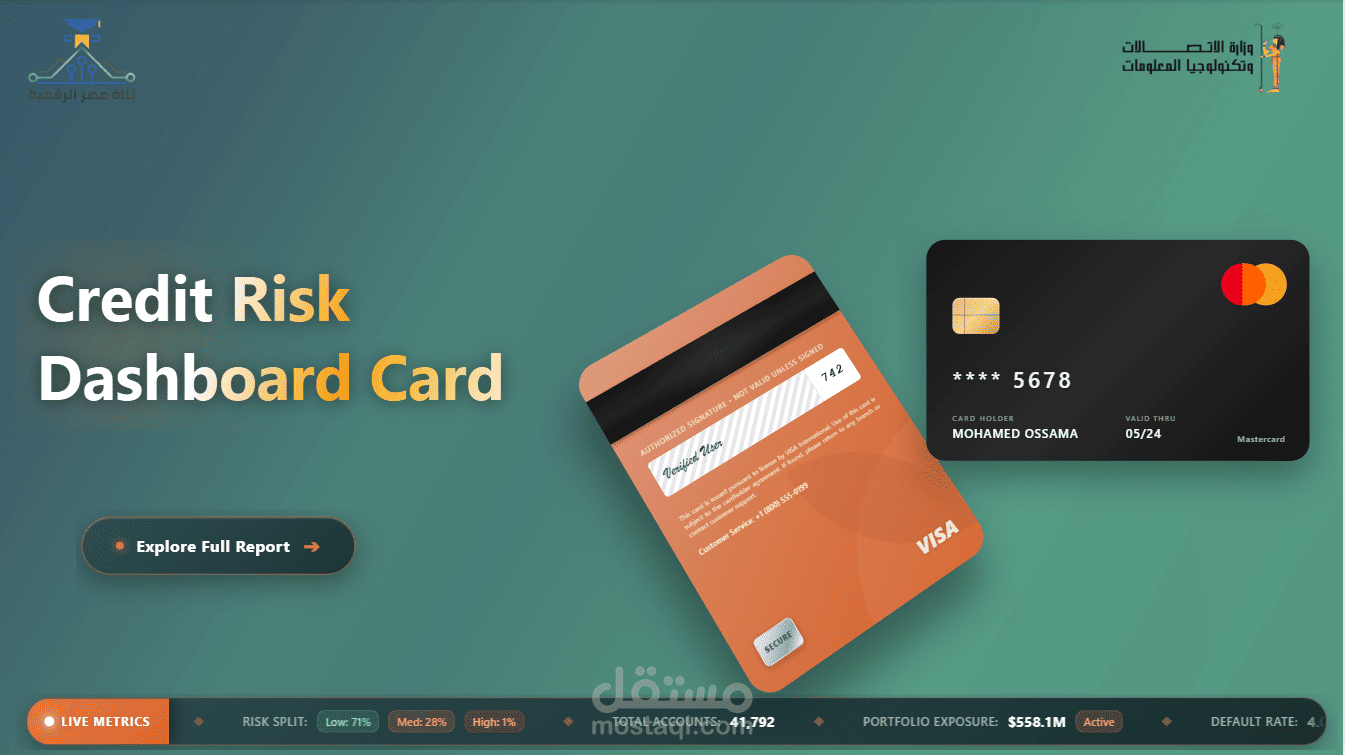
Credit Risk Dashboard – Credit Card Analytics | Power BI
Project Overview
Designed an interactive Credit Risk Dashboard using Microsoft Power BI to monitor credit card portfolio performance, analyze credit utilization, evaluate credit limits, and visualize risk distribution across customer segments.
The dashboard provides a clear overview of key financial metrics through an executive-style interface, enabling stakeholders to monitor portfolio health and identify potential credit risk exposure.
Key Features
Credit Utilization Analysis: Monitor average credit utilization across the portfolio.
Credit Limit Monitoring: Track average credit limits and assess credit exposure.
Transaction Volume Analysis: Visualize total transaction volume to understand portfolio activity.
Risk Segmentation: Analyze the distribution of customers across Low, Medium, and High credit risk categories.
Executive KPI Overview: Present key performance indicators in a clean, visually engaging layout.
Professional UI/UX Design: Create a modern dashboard interface with clear visual hierarchy, intuitive navigation, and a consistent color palette.
Key Metrics Displayed
Average Utilization: 22.2%
Average Credit Limit: $153.5K
Total Transaction Volume: $31.6B
Risk Distribution: Low Risk 71%, Medium Risk 28%, High Risk 1%
Tools & Skills
Microsoft Power BI | Data Visualization | KPI Reporting | Credit Risk Analytics | Dashboard Design | Business Intelligence
Project Objective
Transform financial data into actionable insights through an intuitive dashboard that supports portfolio monitoring, risk assessment, and data-driven decision-making.