Excutive Analysis
تفاصيل العمل
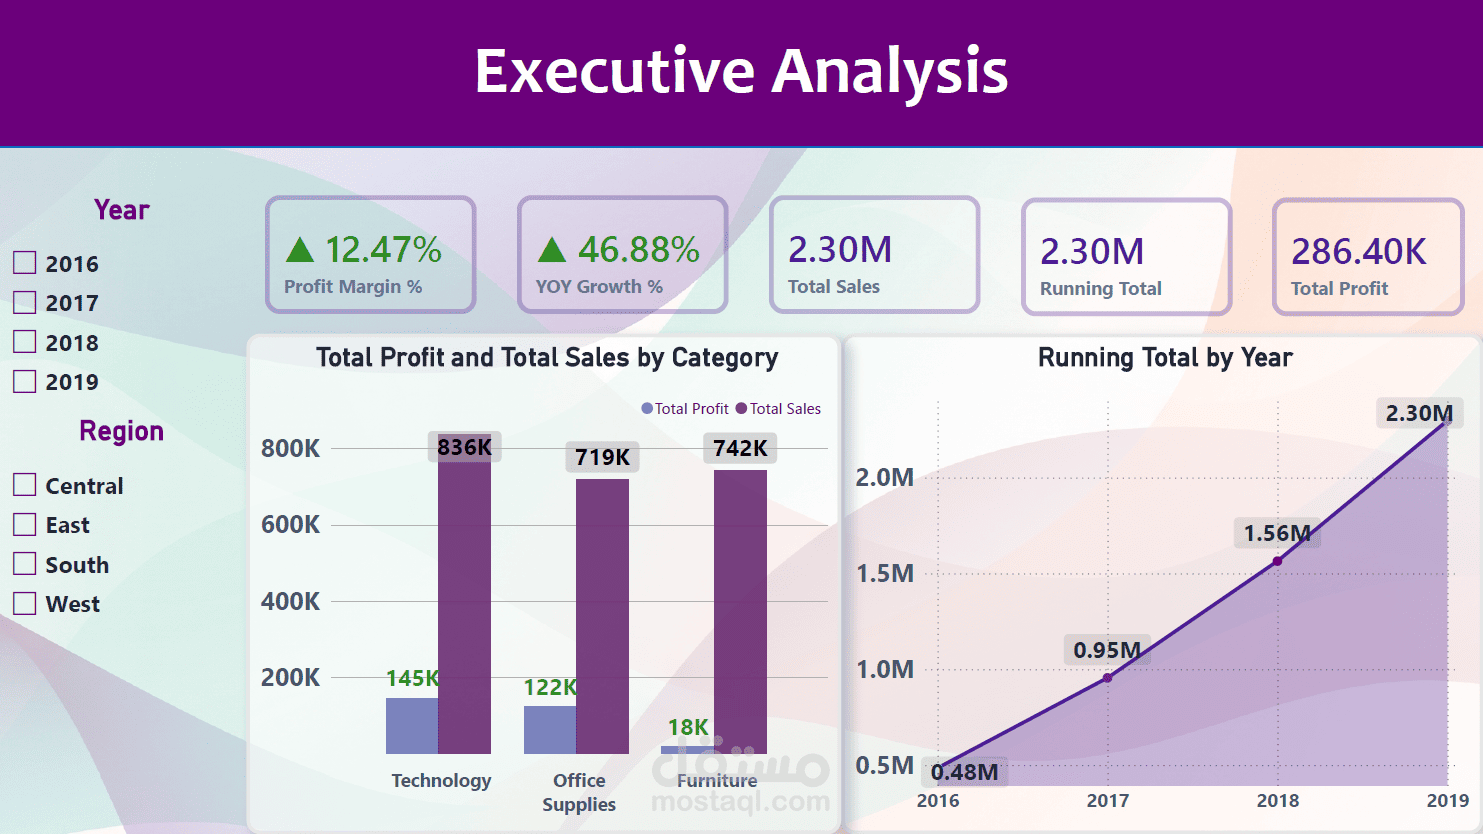
Project Title
Superstore Automated Reporting & DAX Analysis Dashboard
Project Objective
Developed an automated reporting solution and calculated key performance indicators (KPIs) for management using Microsoft Power BI.
Key Responsibilities & Executed Tasks
Data Extraction & Transformation
Imported the "Sample - Superstore 2019" dataset and utilized Power Query Editor to clean and transform the raw data.
Data Modeling:
Designed a structured, proper data model and established a date hierarchy for accurate time-intelligence reporting.
DAX Engineering:
Formulated essential business metrics using DAX measures, including Total Sales, Total Profit, Profit Margin %, Running Total, and Year-over-Year (YoY) Growth.
Calculated Columns:
Created custom columns to evaluate business logistics, such as Profitability Category and Shipping Delay.
Dashboard Development:
Built dedicated analytical report pages focusing on Executive Analysis and Product Analysis. Interactive Features: Enhanced the user experience by implementing slicers, dynamic filtering, and drill-through functionality for deep data exploration.
Technical Highlights:Developed 5+ complex DAX measures and multiple calculated columns. Delivered a comprehensive multi-page report featuring interactive data visualizations.