Student Performance Analysis | Power BI Dashboard
تفاصيل العمل
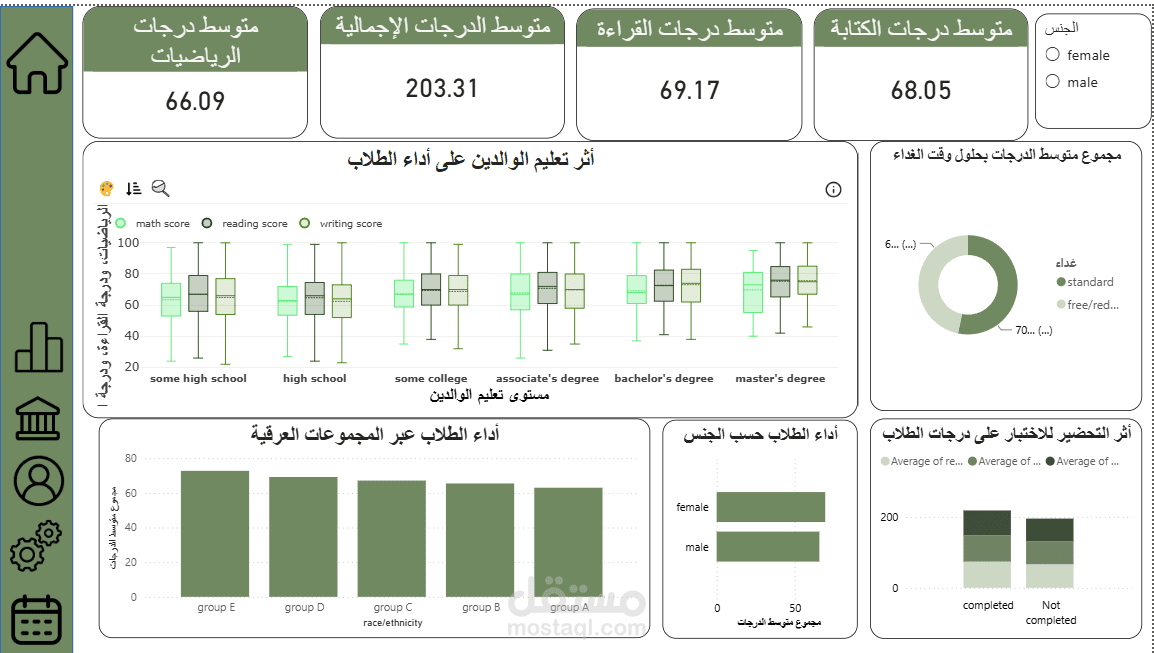
I built an interactive Power BI dashboard analyzing student exam performance in math, reading, and writing, and how it relates to gender, ethnic group, lunch type, test preparation, and parents' education level.
Problem:
Understanding which factors are associated with higher or lower exam scores is hard to see from a raw table of student records.
Solution:
- Created DAX measures for average math, reading, writing, and overall scores.
- Built comparison charts by gender, ethnic group, and lunch type.
- Added a box-and-whisker plot to show score distribution by parents' education level.
- Compared students who completed the test preparation course with those who did not.
- Added a gender slicer so the whole dashboard filters interactively.
Result:
A clear one-page dashboard that shows how each factor relates to student scores, helping teachers or school managers identify which groups may need more support.
Tools: Power BI Desktop (DAX measures, Clustered Bar/Column charts, Donut chart, Cards, Slicers, custom Box & Whisker visual).