Superstore Dashboard
تفاصيل العمل
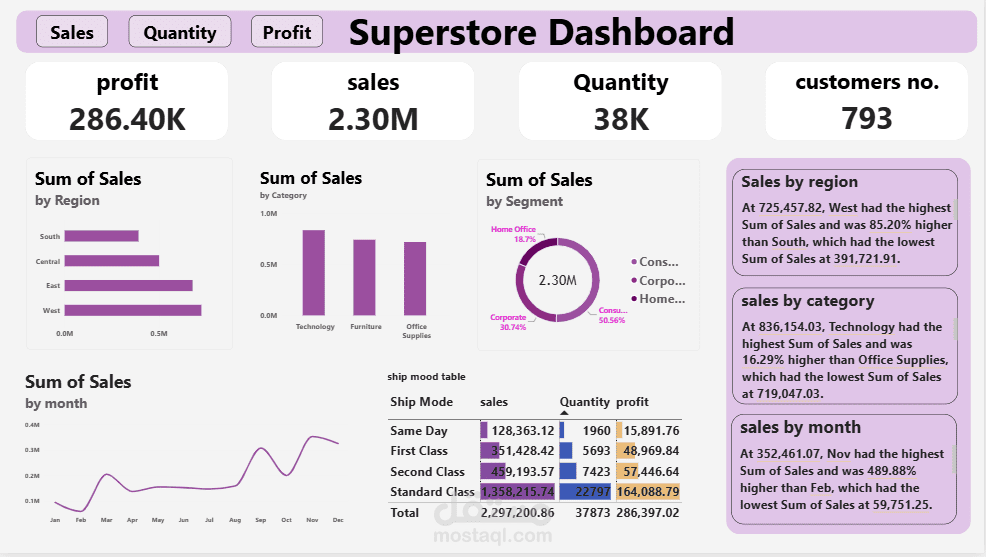
Superstore Dashboard | Power BI
Developed an interactive Power BI dashboard to analyze Superstore performance across sales, profit, and quantity.
Key Features & Analysis
Sales Analysis: Compared sales across regions, product categories, and customer segments.
Profit Analysis: Evaluated profitability by region, category, segment, and month.
Quantity Analysis: Identified top-performing product categories, regions, and customer segments.
Monthly Trends: Analyzed monthly changes in sales, profit, and quantity to identify trends.
Shipping Analysis: Compared sales, profit, and quantity across shipping modes.
Key Performance Indicators (KPIs)
Total Sales | Total Profit | Total Quantity | Number of Customers
Tools & Skills
Microsoft Power BI, DAX, Data Visualization, KPI Development, Business Intelligence, Sales Analysis, Profitability Analysis, Interactive Dashboard Design.