Bicycle Retailer & Repair Shop
تفاصيل العمل
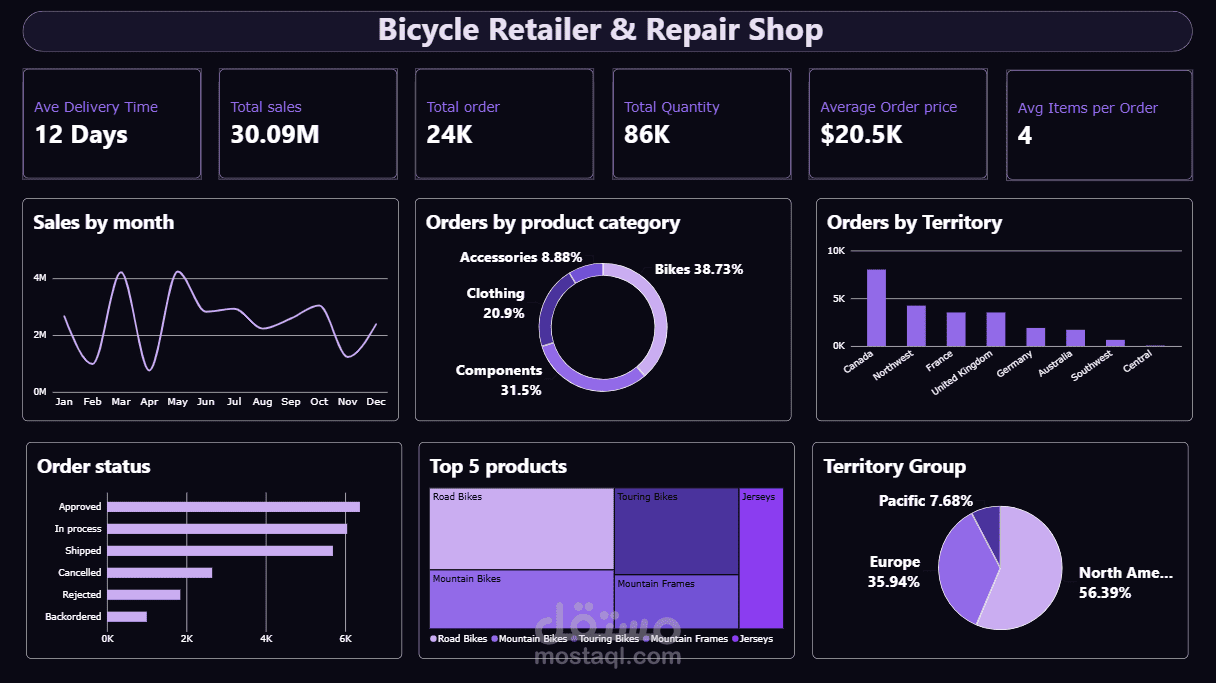
## Bicycle Retailer & Repair Shop – Sales Analysis Dashboard
Developed an interactive Power BI dashboard to analyze sales performance, order trends, product categories, and regional distribution for a bicycle retail and repair business.
The dashboard provides key performance indicators (KPIs), including total sales, total orders, total quantity sold, average order price, average items per order, and average delivery time. It also visualizes monthly sales trends, order distribution by product category and territory, order status breakdowns, top-selling products, and sales distribution across territory groups.
**Key Insights:**
- Monitored monthly sales performance to identify fluctuations and seasonal trends.
- Analyzed product categories to understand their contribution to total orders.
- Compared order volumes across territories and geographical groups.
- Evaluated order statuses to track order processing, shipping, cancellations, and rejections.
- Identified leading products, including road bikes, mountain bikes, touring bikes, mountain frames, and jerseys.
**Tools & Skills:** Microsoft Power BI, Data Visualization, KPI Analysis, Sales Analytics, Business Intelligence, Dashboard Design.