Real Estate Performance Dashboard
تفاصيل العمل
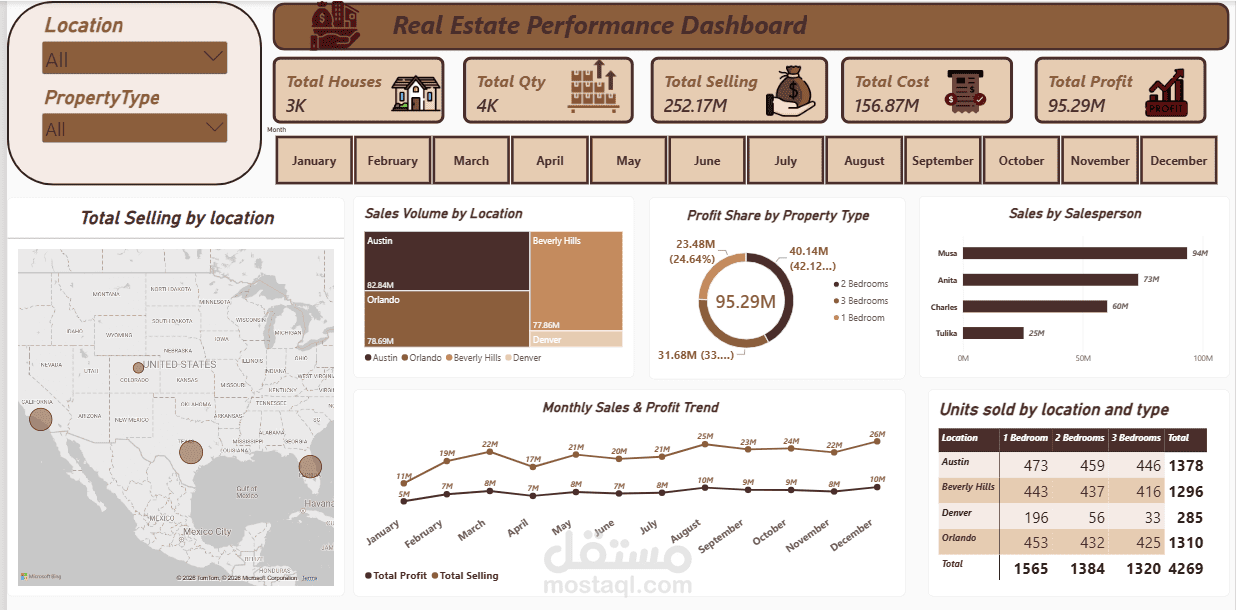
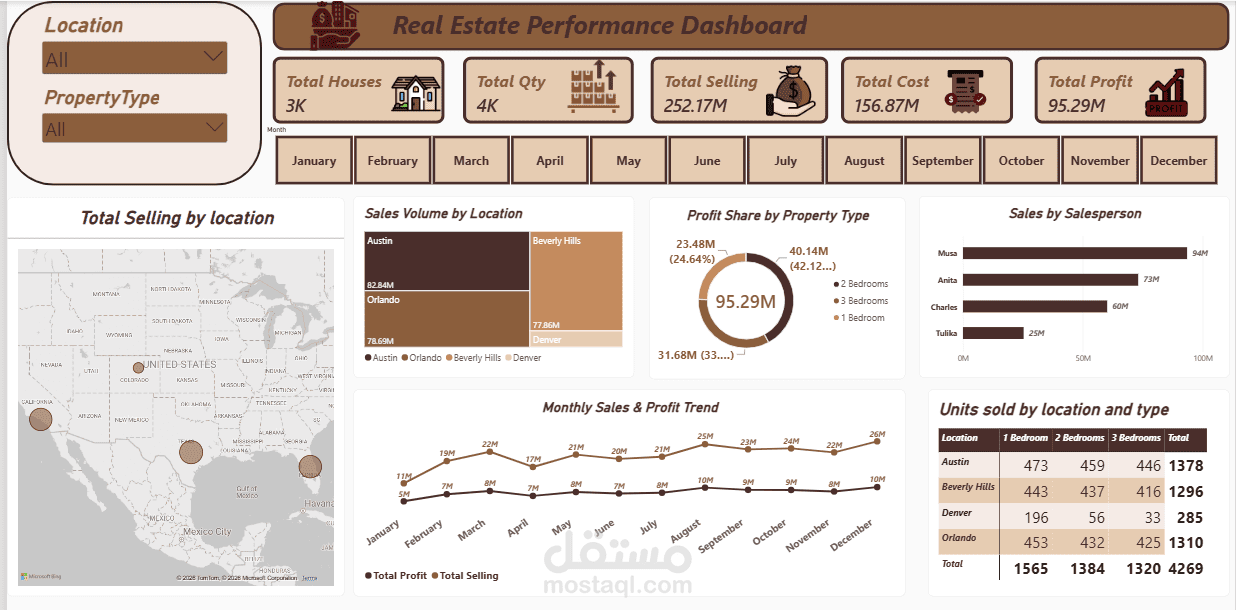
Executive Overview:
Designed and built an end-to-end interactive Real Estate Performance Dashboard to help decision-makers, stakeholders, and sales leaders track key financial metrics, evaluate sales team effectiveness, and discover regional market trends in real-time.
Key Metrics & Analytical Views (KPIs & Visuals):
Executive Summary KPIs: High-level metric cards displaying Total Houses (3K), Total Quantity (4K), Total Selling Revenue ($252.17M), Total Cost ($156.87M), and Total Net Profit ($95.29M).
Geographic Distribution: Interactive geospatial mapping (Total Selling by Location) visualizing sales density across target US regions.
Regional Revenue Comparison: Tree map breakdown (Sales Volume by Location) contrasting key markets (Austin, Orlando, Beverly Hills, and Denver).
Profitability by Asset Class: Donut chart analysis (Profit Share by Property Type) segmenting margins across 1-bedroom, 2-bedroom, and 3-bedroom properties.
Sales Rep Performance Benchmarking: Horizontal bar chart (Sales by Salesperson) ranking top-performing sales managers (Musa, Anita, Charles, Tulika) to incentivize growth.
Monthly Financial Trajectory: Dual-line trend chart (Monthly Sales & Profit Trend) tracking seasonality and revenue vs. profit dynamics from January through December.
Detailed Property Matrix: Cross-tabulated matrix (Units Sold by Location and Type) summarizing granular unit volume across cities and room configurations (4,269 total units).
UI/UX & Interactive Capabilities:
Dynamic Filtering: Integrated global slicers for Location, Property Type, and Month for effortless drill-down exploration.
Professional Aesthetic: Styled with a sleek, high-contrast corporate palette (Burgundy & Warm Earth Tones) adhering to UI/UX dashboard design standards for maximum legibility.
Technical Stack & Tools Used:
Microsoft Excel: Data cleaning & transformation, PivotTables, Advanced Formulas, Dynamic Slicers, and Data Visualization.