Petroleum Operations & Financial Performance Dashboard (Power BI& Excel)
تفاصيل العمل
📊 Petroleum Operations & Financial Performance Dashboard
I’m excited to share my latest Data Analytics project, where I analyzed a global petroleum operations dataset to track production efficiency, operational costs, and financial metrics.
Here is a breakdown of what was accomplished across the project stages:
1. Excel & Power Query (Data Preparation & Dashboard):
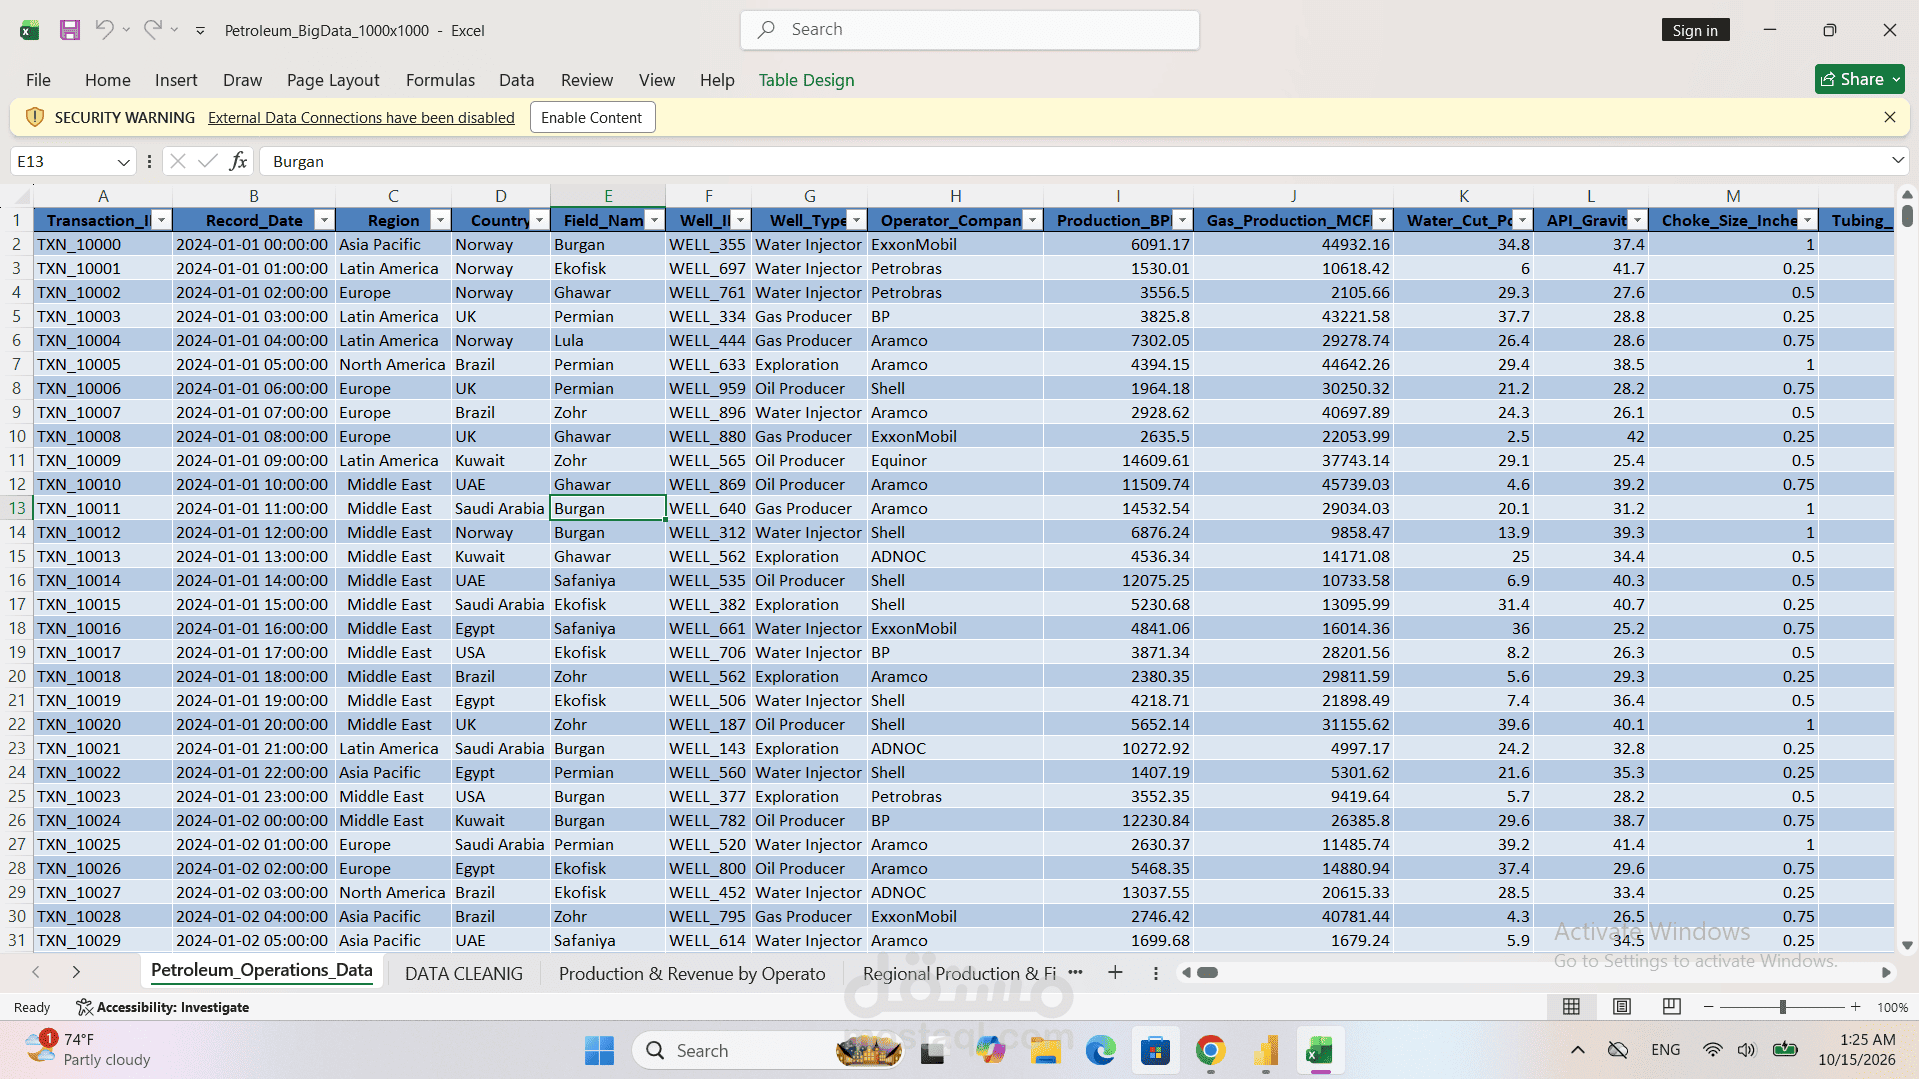
• Cleaned and structured 1M+ raw petroleum records, standardizing operator companies (Aramco, ExxonMobil, Shell, BP, ADNOC, Equinor, Petrobras) and well types.
• Built interactive Pivot Tables and Dynamic Charts to analyze production vs. water cut percentages.
• Designed a dark-themed Excel dashboard featuring revenue vs. operating cost models and interactive region/maintenance slicers.
2. Power BI - Financial & Operations Overview (Dashboard - 1st View):
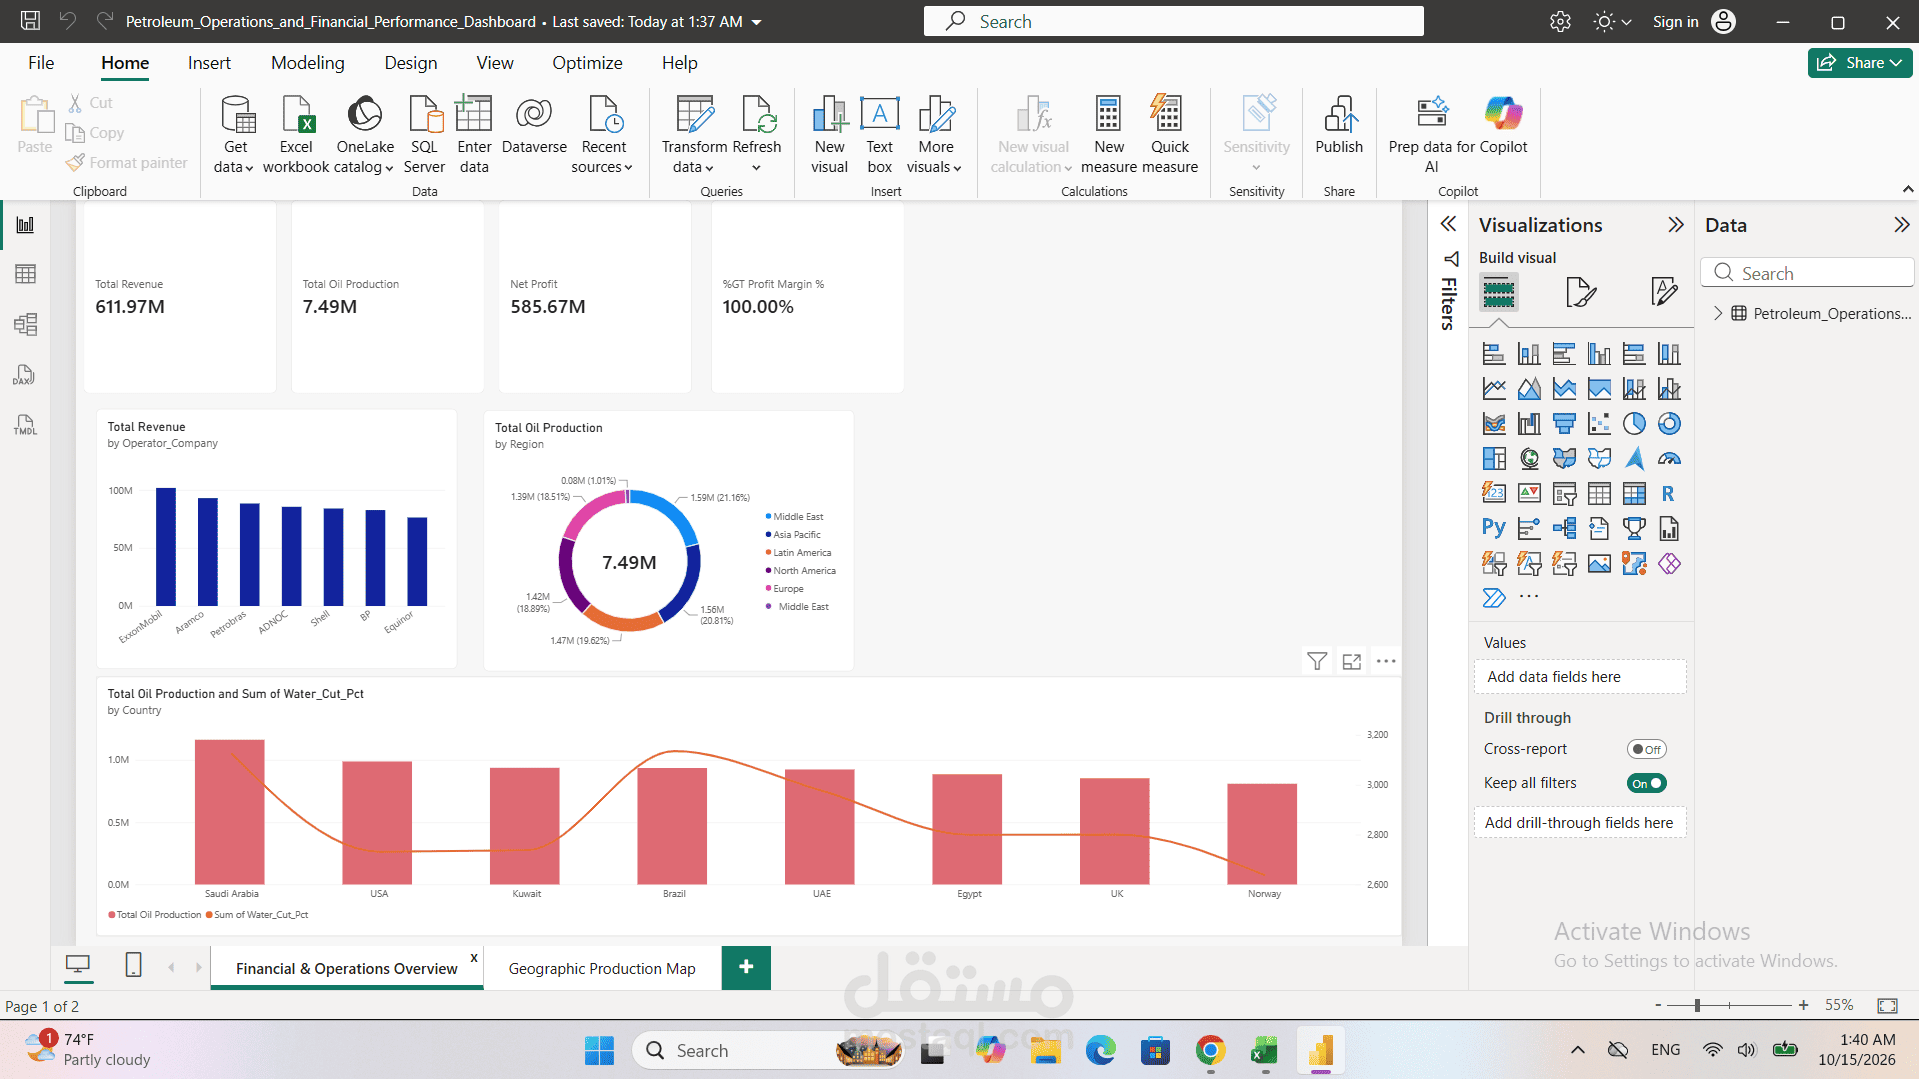
• Designed high-level KPI Scorecards tracking Total Revenue ($611.97M), Total Oil Production (7.49M BPD), and Net Profit ($585.67M).
• Developed a Bar Chart comparing Total Revenue by Operator Companies and a Donut Chart for regional production breakdowns.
• Created a dual-axis combo chart analyzing Total Oil Production alongside Average Water Cut % across major producing countries (Saudi Arabia, USA, Kuwait, Brazil, UAE, Egypt, UK, Norway).
3. Power BI - Geographical Production Map (Dashboard - 2nd View):
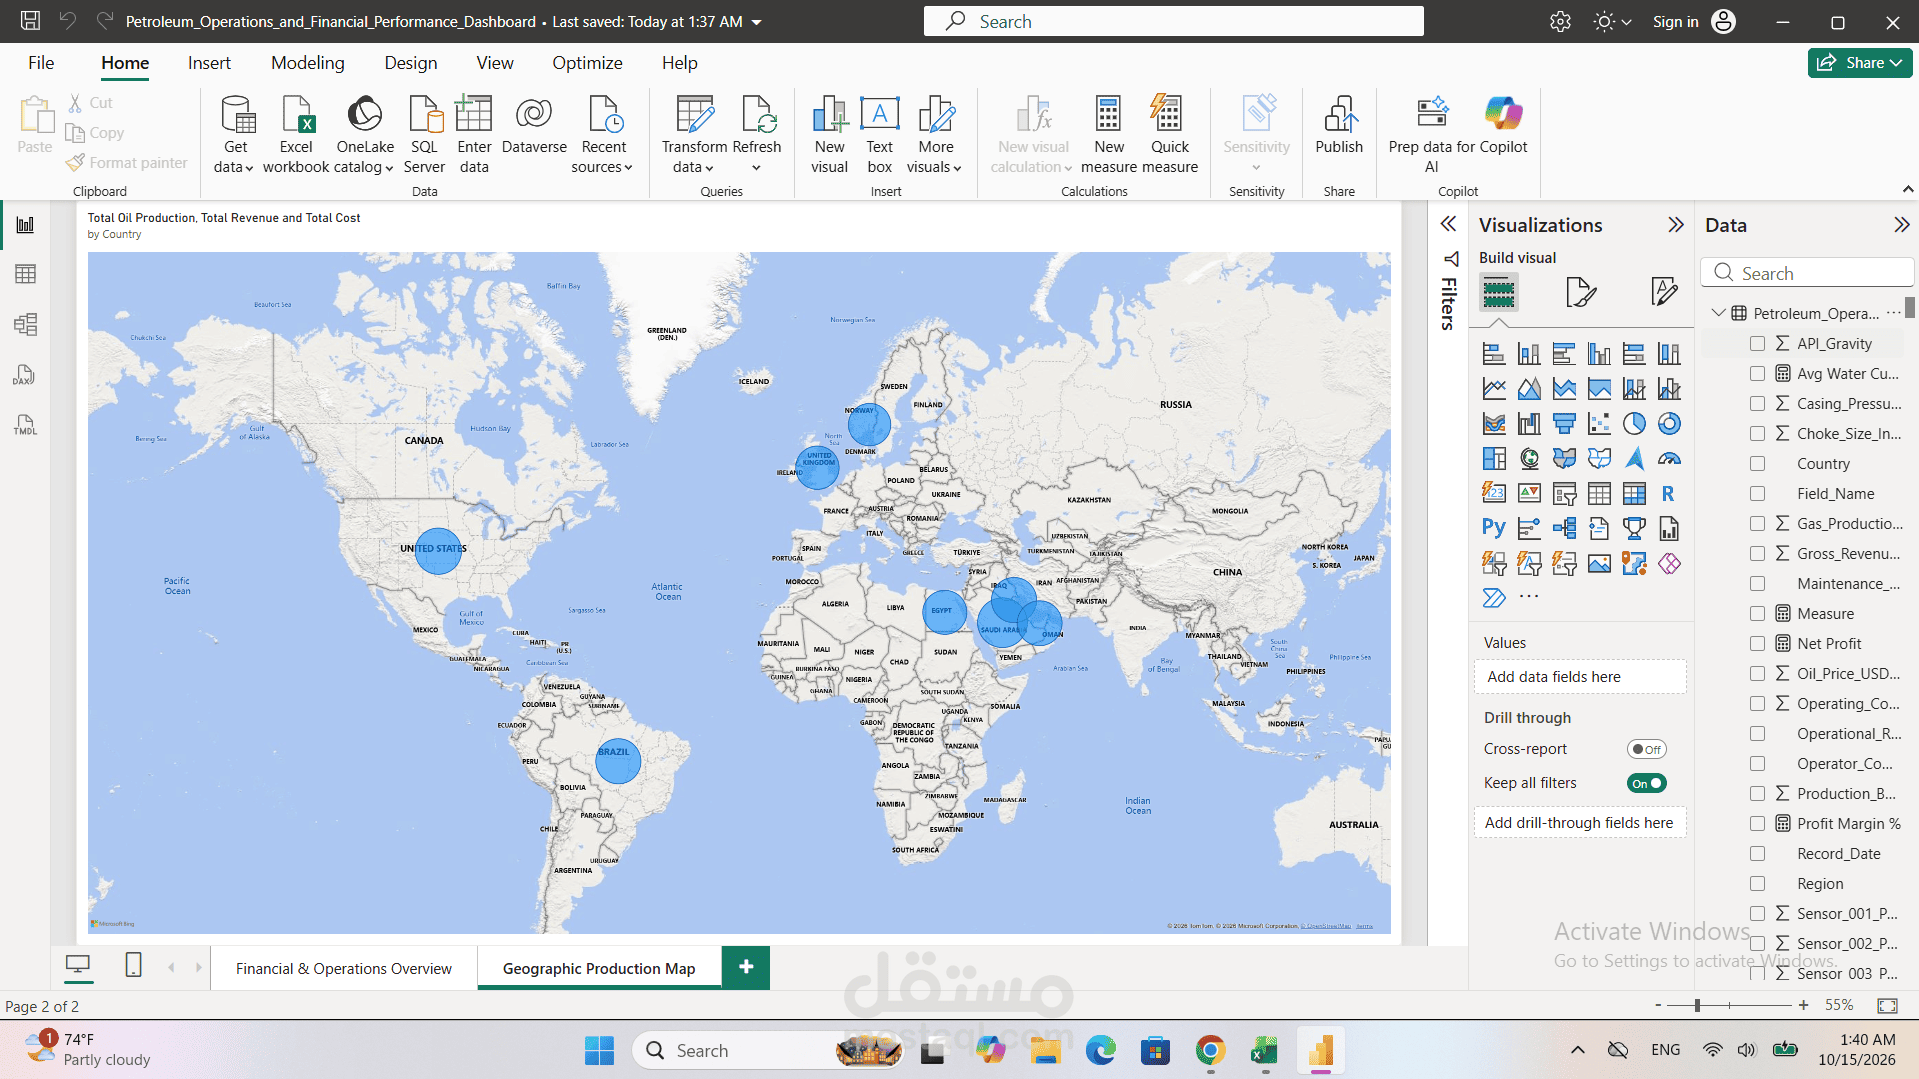
• Implemented an interactive Geospatial Map visualization to geographically display production volumes, revenues, and operational footprints across continents and countries.
Tools Used: Microsoft Excel | Power Query | Power BI | DAX | Data Modeling | Business Intelligence
#DataAnalytics #PowerBI #Excel #BusinessIntelligence #DataVisualization #Dashboards #Petroleum