Automated Year-Over-Year Revenue Comparative Analysis & Visualization Tool
تفاصيل العمل
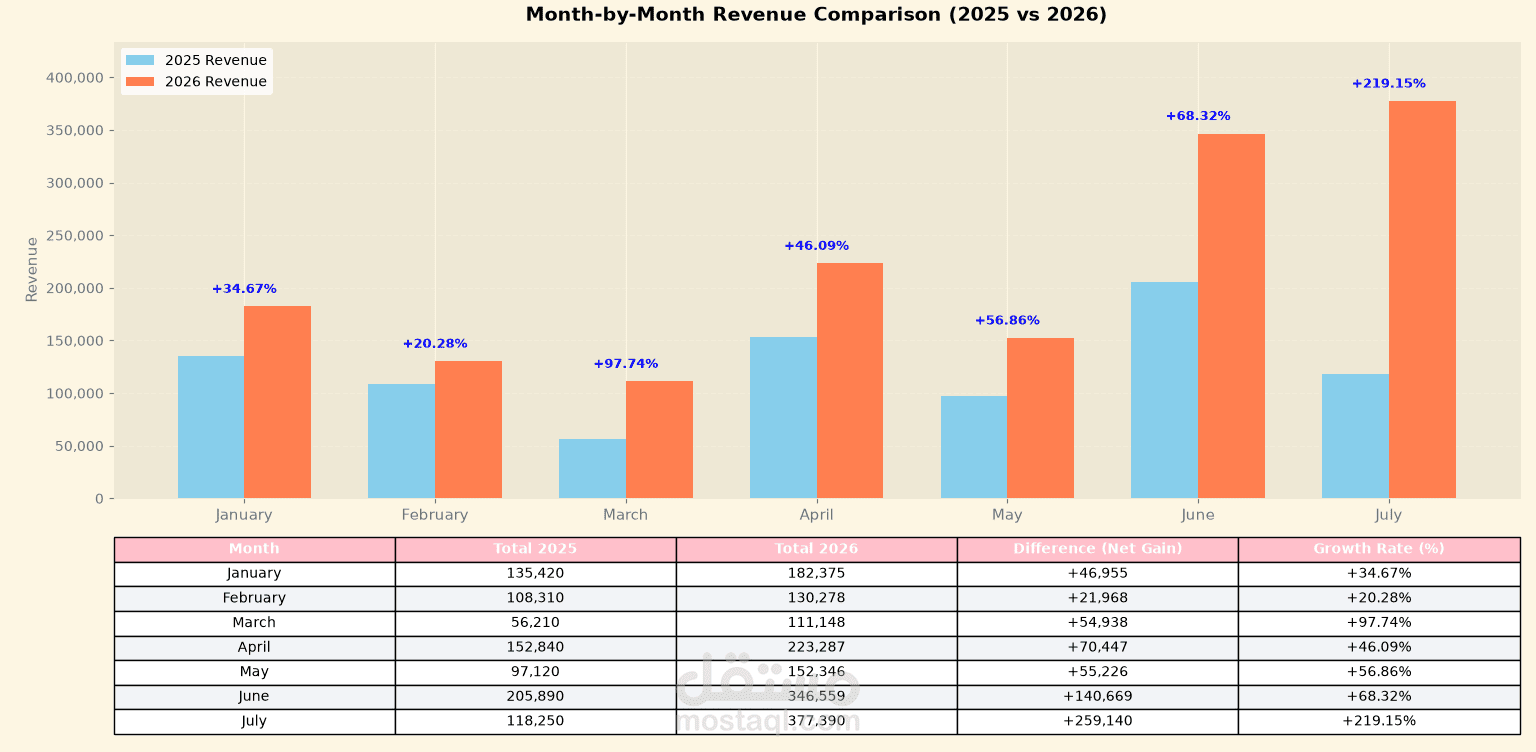
eveloped a custom Python script using Pandas, Matplotlib, Seaborn, and NumPy to perform a month-by-month financial comparative analysis comparing performance across consecutive fiscal years. Built an automated data manipulation pipeline to compute net gain differences and percentage growth metrics dynamically. Designed a publication-quality data visualization board featuring side-by-side grouped bar charts paired with dynamic data callout labels for growth rates above each monthly pair. Integrated a custom-styled summary data table directly within the output layout, featuring alternating row shading, custom header formatting, and clean numeric formatting for executive review and financial reporting.