Kickstarter Crowdfunding Analysis Dashboard
تفاصيل العمل
Description:
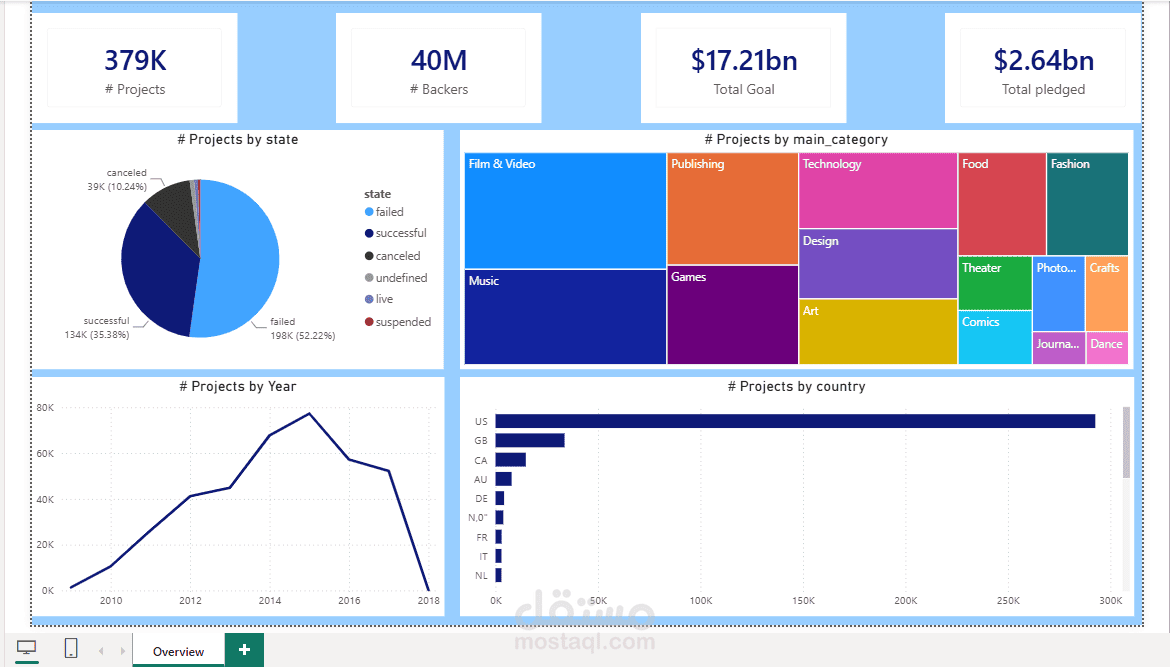
Designed and built an interactive Power BI dashboard analyzing Kickstarter crowdfunding projects to uncover what drives campaign success. I prepared a dataset of hundreds of thousands of projects, filtered out invalid launch dates (1970), and created a category hierarchy (main category → category → project) to enable drill-down analysis. Using DAX, I defined key measures: number of projects, number of backers, total funding goal, and total amount pledged. The Overview page includes:
KPI cards summarizing projects, backers, total goal, and total pledged
A pie chart showing project outcomes (successful, failed, canceled, live, suspended)
A treemap of projects by category, with drill-down to individual projects
A line chart showing the number of projects launched each year
A bar chart comparing the number of projects by country
Tools: Power BI, DAX, Data Modeling, Data Visualization