coffe shop
تفاصيل العمل
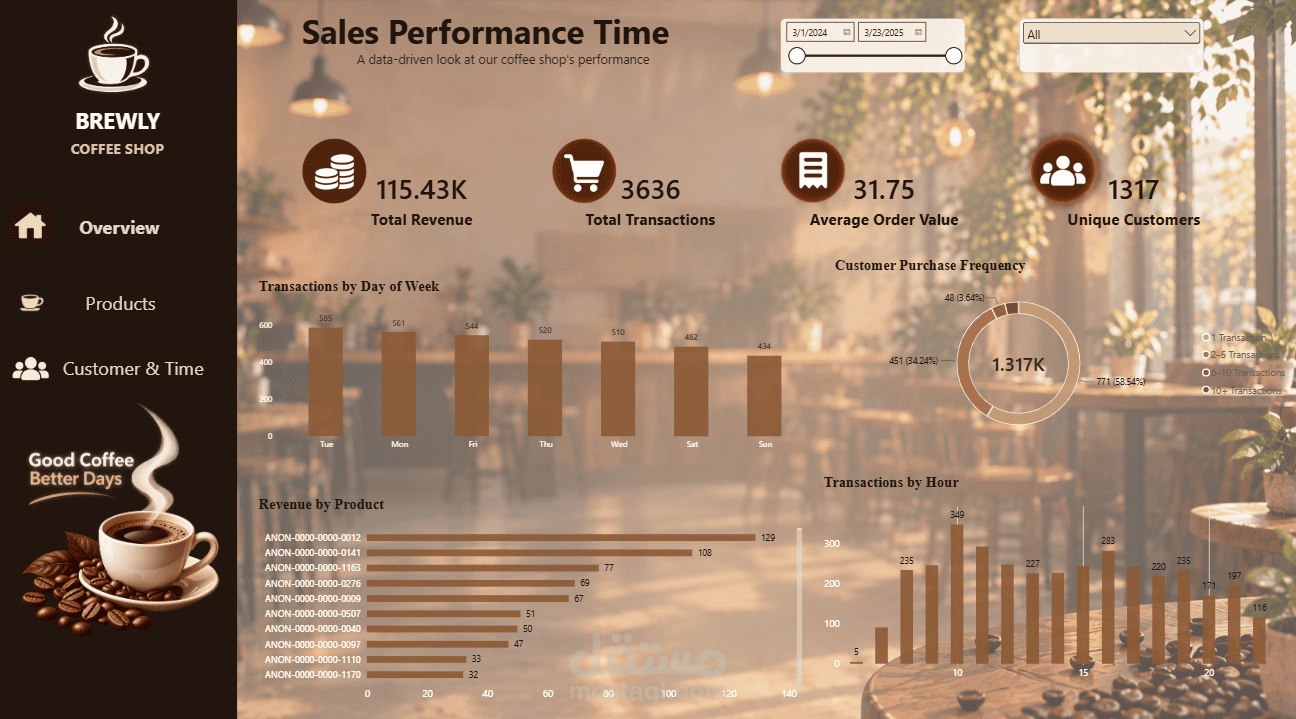
Brewly Coffee Shop Analytics Dashboard
An interactive Power BI dashboard designed to analyze coffee shop sales performance, product popularity, and customer purchasing behavior.
The dashboard transforms raw transaction data into actionable insights through interactive visualizations, KPIs, and filters, helping identify sales trends, best-selling products, peak business hours, and customer purchasing patterns.
Key Features:
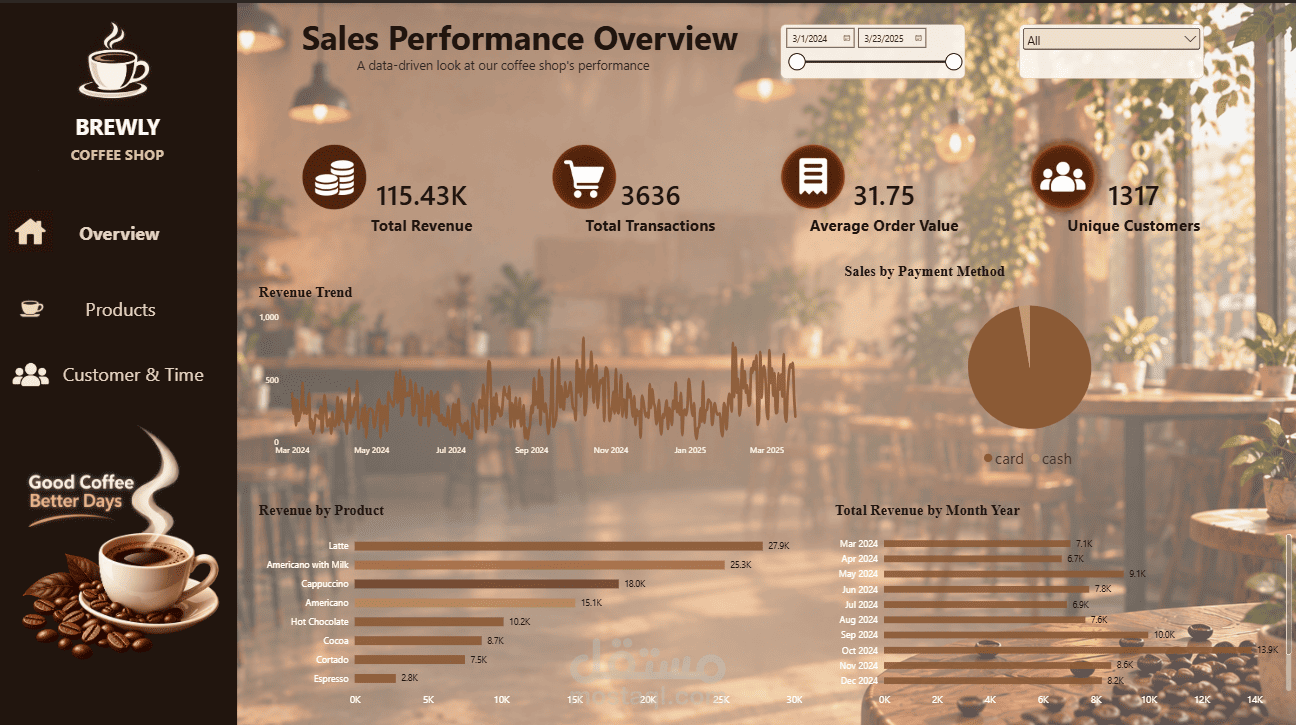
Sales Overview: Track total revenue, transactions, average order value, and unique customers.
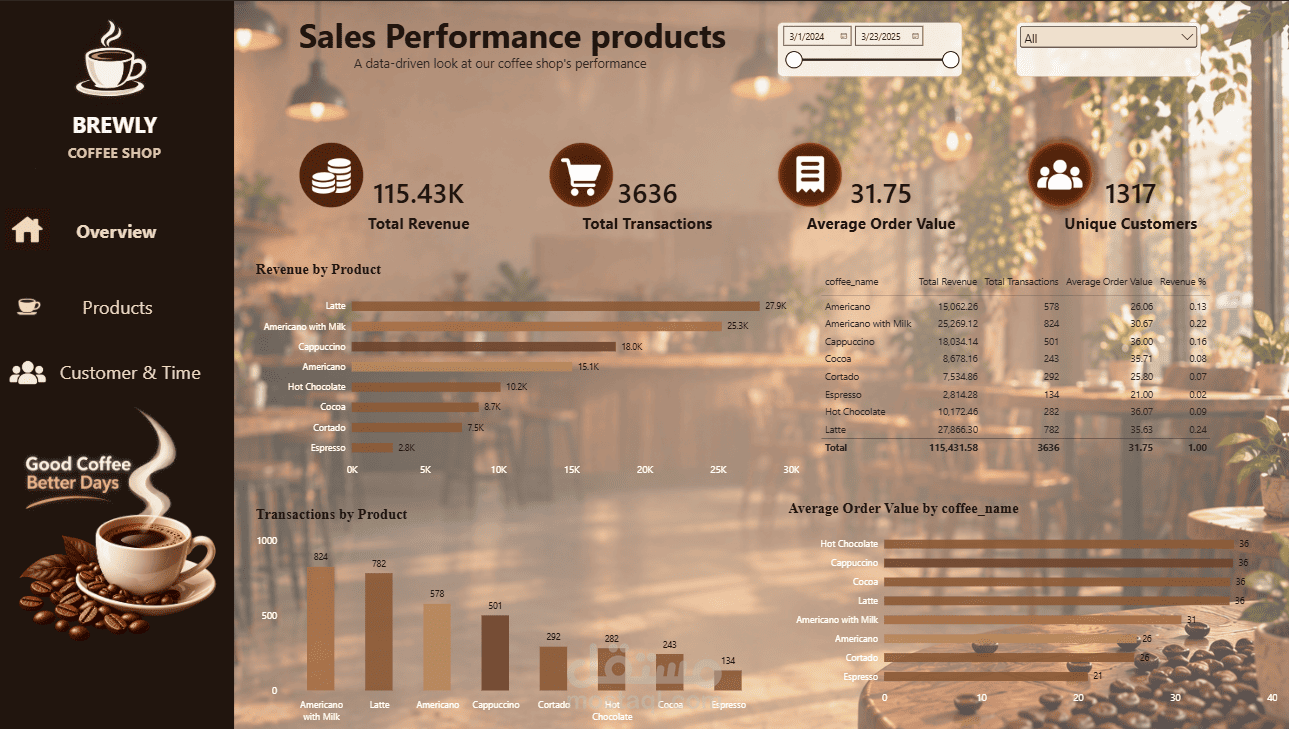
Product Analysis: Compare product performance based on revenue, transaction volume, and average order value.
Customer & Time Analysis: Explore customer purchasing frequency, activity by day of the week, and hourly transaction patterns.
Interactive Filtering: Analyze results by date, coffee product, and payment method.
Tools & Technologies: Power BI, Power Query, DAX, Data Modeling, Data Visualization.
Project Goal: Turn sales data into meaningful business insights that support data-driven decision-making and help improve coffee shop performance.