Huawei Sales & Financial Performance Dashboard | Power BI & Data Analysis
تفاصيل العمل
Project Overview:
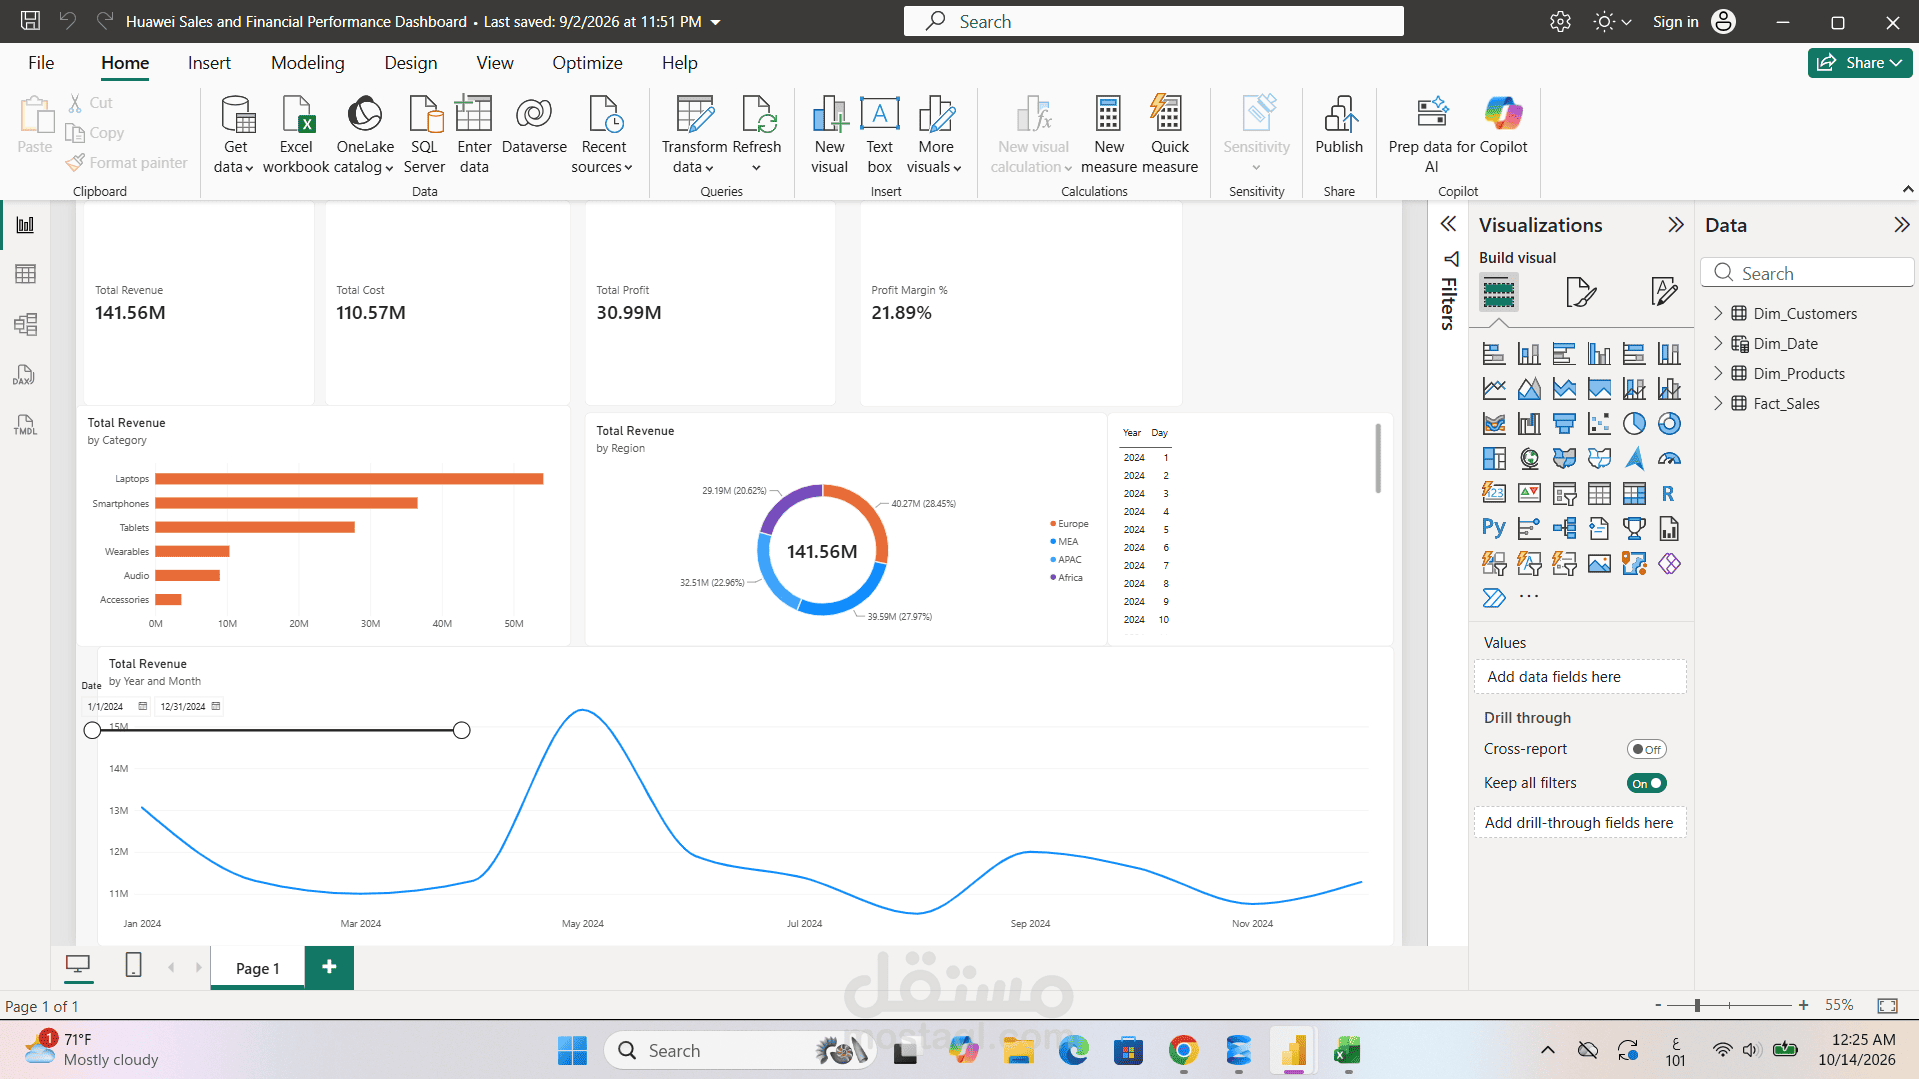
An interactive Sales and Financial Performance Dashboard created in Power BI to analyze revenue streams, cost structures, product categories, and regional growth metrics for Huawei sales data.
Key Implementation Steps & Technical Features:
1. Data Modeling & Architecture:
- Structured a Star Schema data model consisting of Fact_Sales and Dimension tables (Dim_Customers, Dim_Products, Dim_Date).
- Created a custom Date Table to enable accurate time-series analysis and time-intelligence calculations.
2. Advanced DAX Measures & KPIs:
- Developed custom DAX formulas to track core financial performance metrics:
* Total Revenue ($141.56M)
* Total Cost ($110.57M)
* Total Profit ($30.99M)
* Profit Margin % (21.89%)
3. Visual Analytics & Reporting:
- Sales Breakdown by Category: Analyzed top-performing categories (Laptops, Smartphones, Tablets).
- Regional Distribution: Interactive donut chart highlighting sales distribution across key regions (Europe, MEA, APAC, Africa).
- Time-Series Analysis: Dynamic monthly revenue line chart tracking performance trends throughout the year.
- Slicers & Dynamic Filtering: Integrated date range sliders and cross-filtering for seamless drill-down capabilities.