bike sales dashboard
تفاصيل العمل
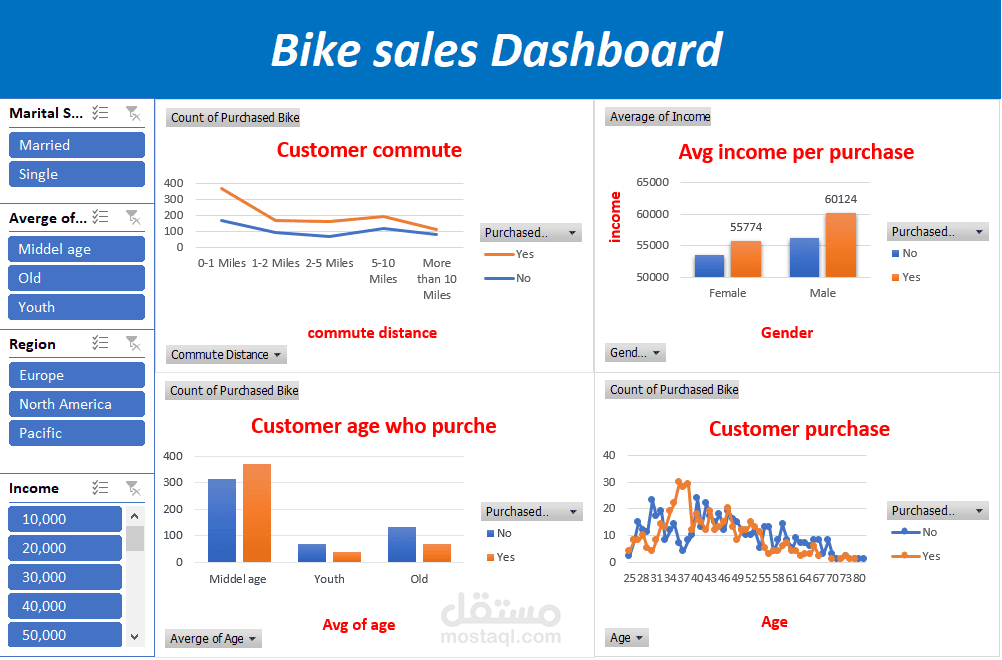
The process involves collecting data from multiple sources, cleaning and organizing it, handling missing or inconsistent values, and transforming it into a structured format. Next, analyze the data to identify trends, patterns, and key performance indicators (KPIs), such as total sales, revenue growth, top-selling products, and regional performance. Finally, visualize the results using charts, tables, and interactive filters in a sales dashboard to support better business decisions