Interactive Data Professional Survey Dashboard Using Power BI
تفاصيل العمل
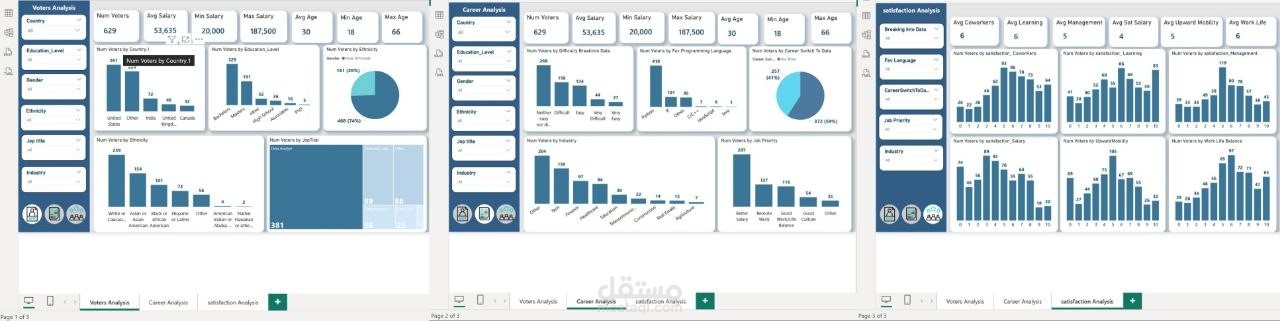
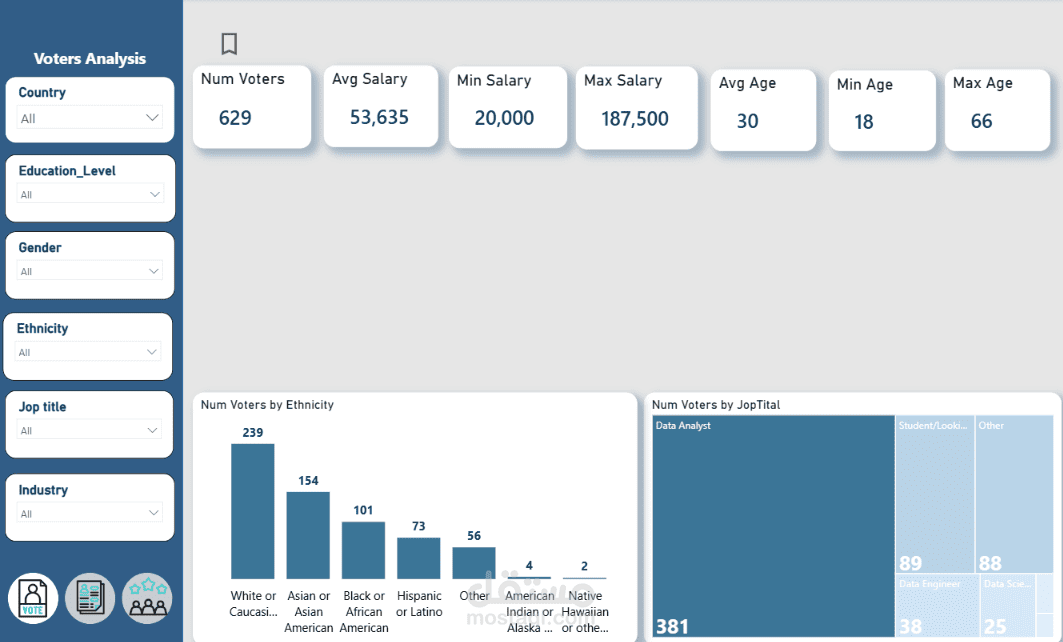
Interactive Data Professional Survey Dashboard Using Microsoft Power BI
: Project Overview
Developed an interactive Power BI report to analyze professional survey data, providing insights into respondents'
. demographics, career paths, technical preferences, and workplace priorities through four analytical dashboards
Key Features
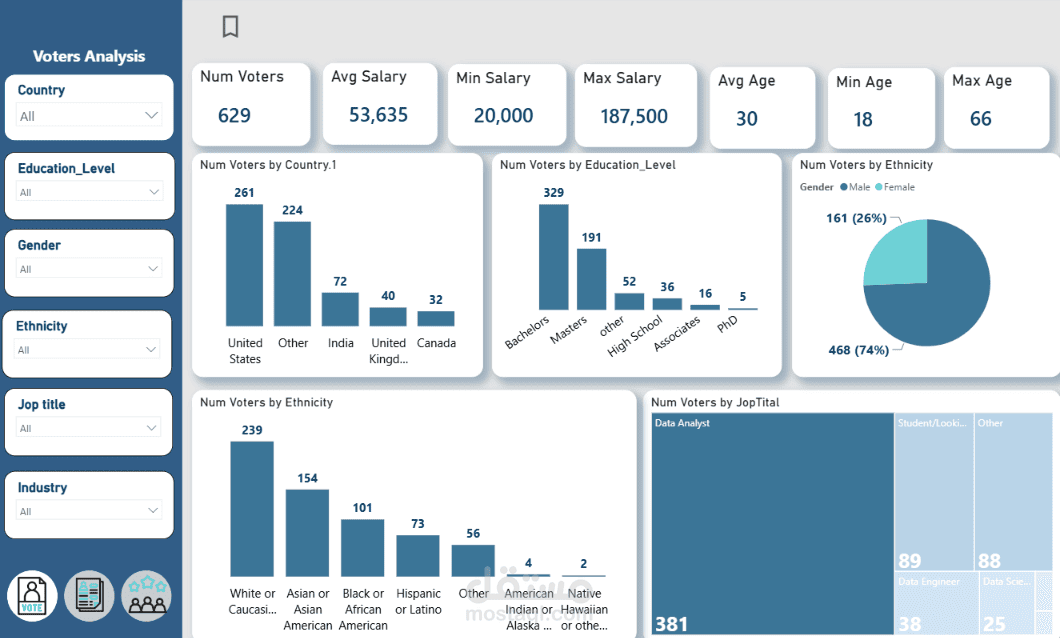
1. Voters Analysis
- Analyzed respondent distribution by country, education level, ethnicity, age, and job title.
- Presented age distribution using both bar and column charts.
- Included KPI cards for average, maximum, and minimum age and salary, as well as total number of voters.
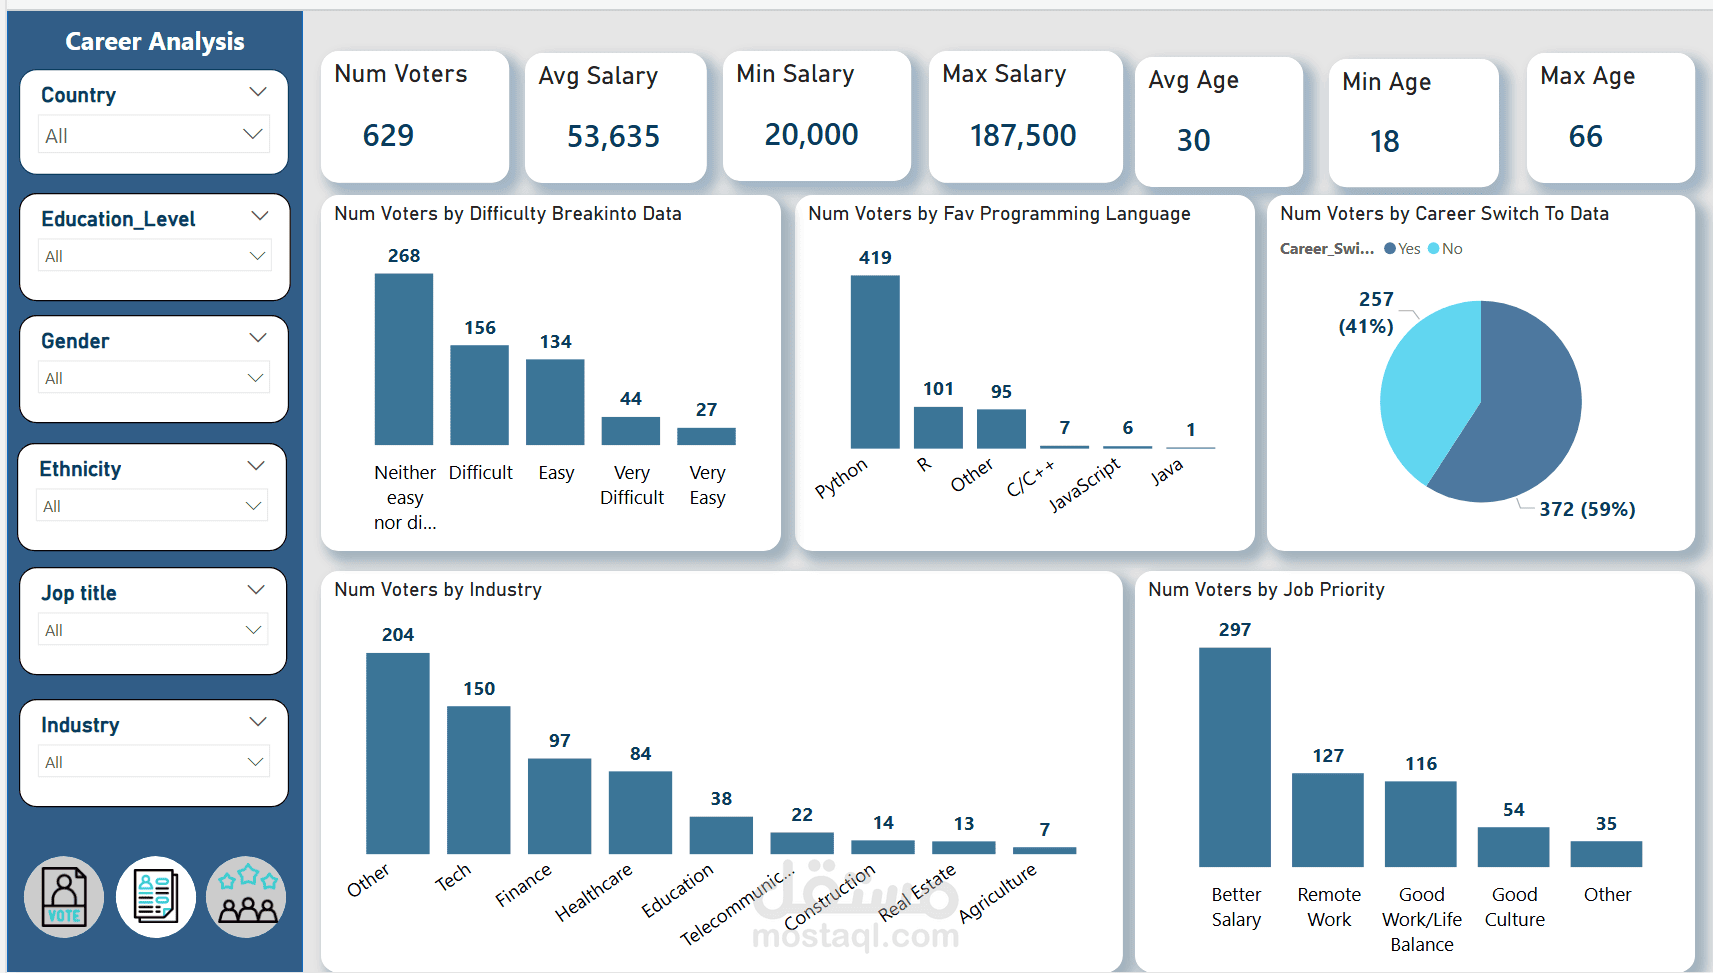
2. Career Analysis
. Explored respondents' career-related preferences and experiences
Analyzed programming language preferences, career switching to data, industry, job variety, difficulty, and breaking
. into data
. Used interactive filters to explore career trends across relevant respondent groups
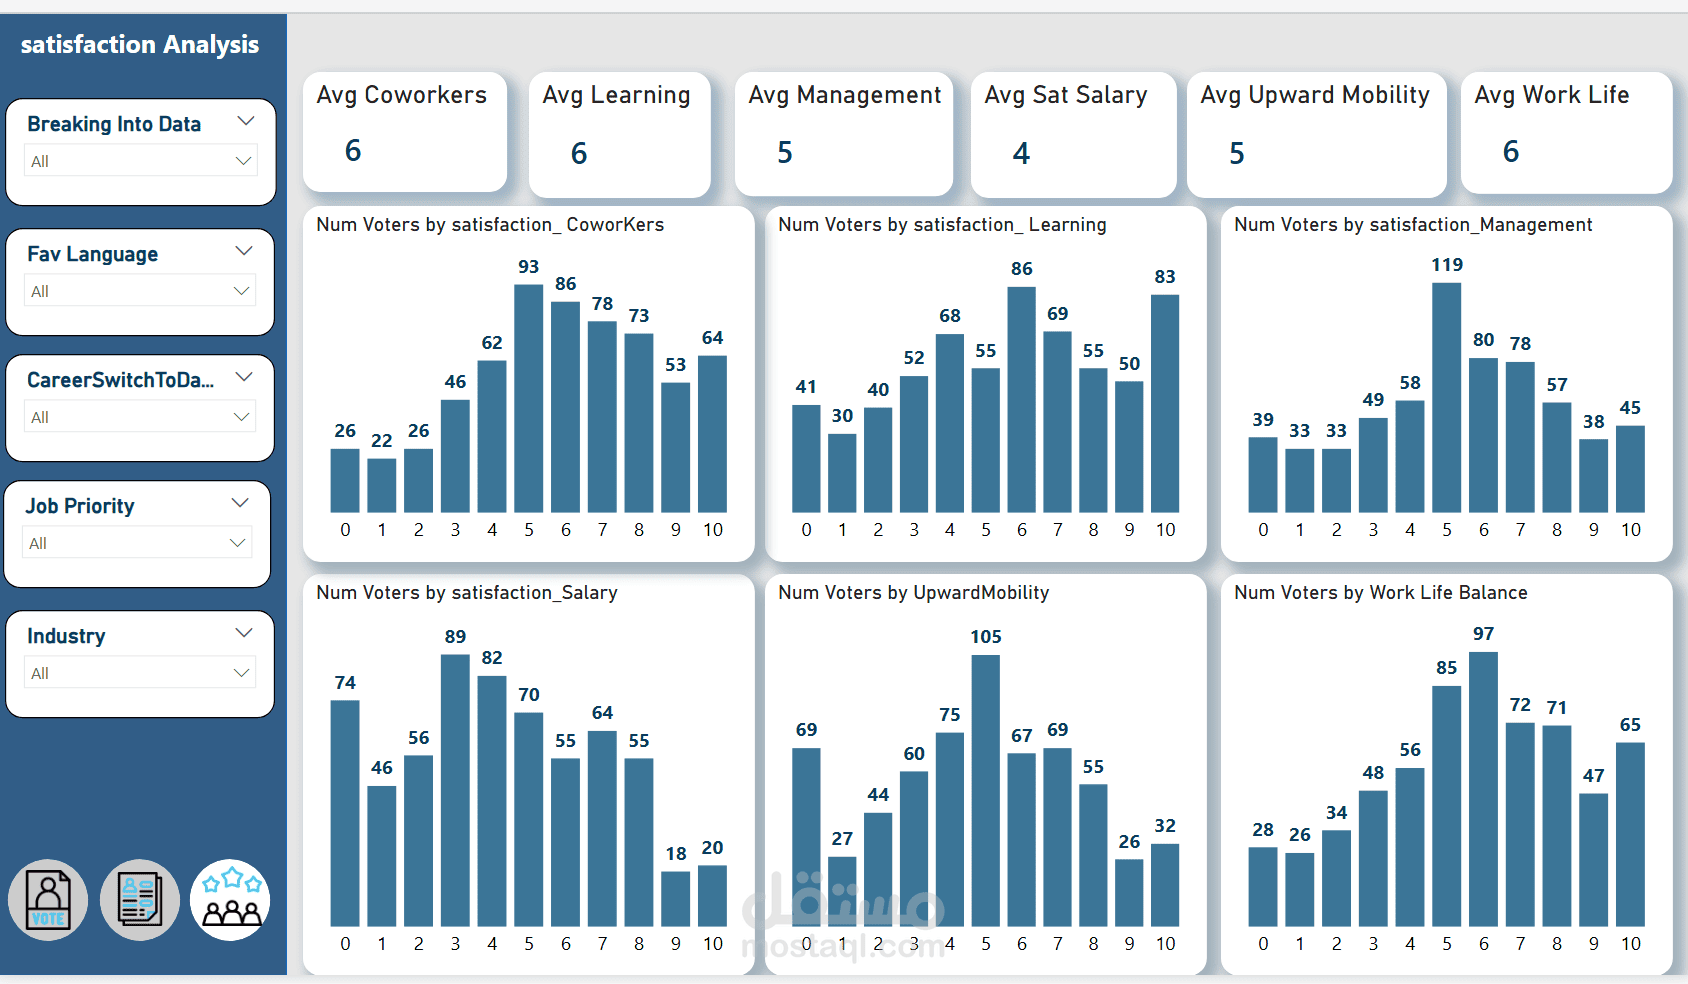
3. Specification Analysis
. Examined professional qualifications and workplace preferences
. Analyzed coworkers, learning, management, salary, mobility, and work-life balance
Included filters for breaking into data, favorite programming language, career switching, job variety, industry, and
. keywords
4. Duplicate Voters Analysis
. Analyzed the number of voters by ethnicity and job type
. Reused key demographic and salary-related KPIs to support further exploration
. Included filters for country, education level, gender, ethnicity, job title, and industry
: Technical Implementation
. Used Power Query to clean and prepare the survey data
. Created DAX measures for average, maximum, and minimum age and salary, and number of voters
. Designed interactive visualizations, KPI cards, and dashboard-specific slicers
. Organized the report across multiple pages, including Details, Total Lab 1, Total Lab 2, and Parameters
. Included page navigation to make moving between report pages easier
: Tools & Technologies
. Microsoft Power BI, Power Query, DAX, Data Analysis, and Data Visualization
: Project Objective
To transform professional survey data into an interactive analytical report that enables users to explore respondent demographics, career trends, technical interests, qualifications, and workplace priorities through focused dashboards and dynamic filtering.