data visualuzation
تفاصيل العمل
@@ Kickstarter projects
- Data Source: Two CSV Files (2016,2018)
Data Transformation:
- Create Custom Column has the file name (ex: 2016 or ks-projects-201612) (M Language)
- Append (Union) two files using M Language (Power Query)
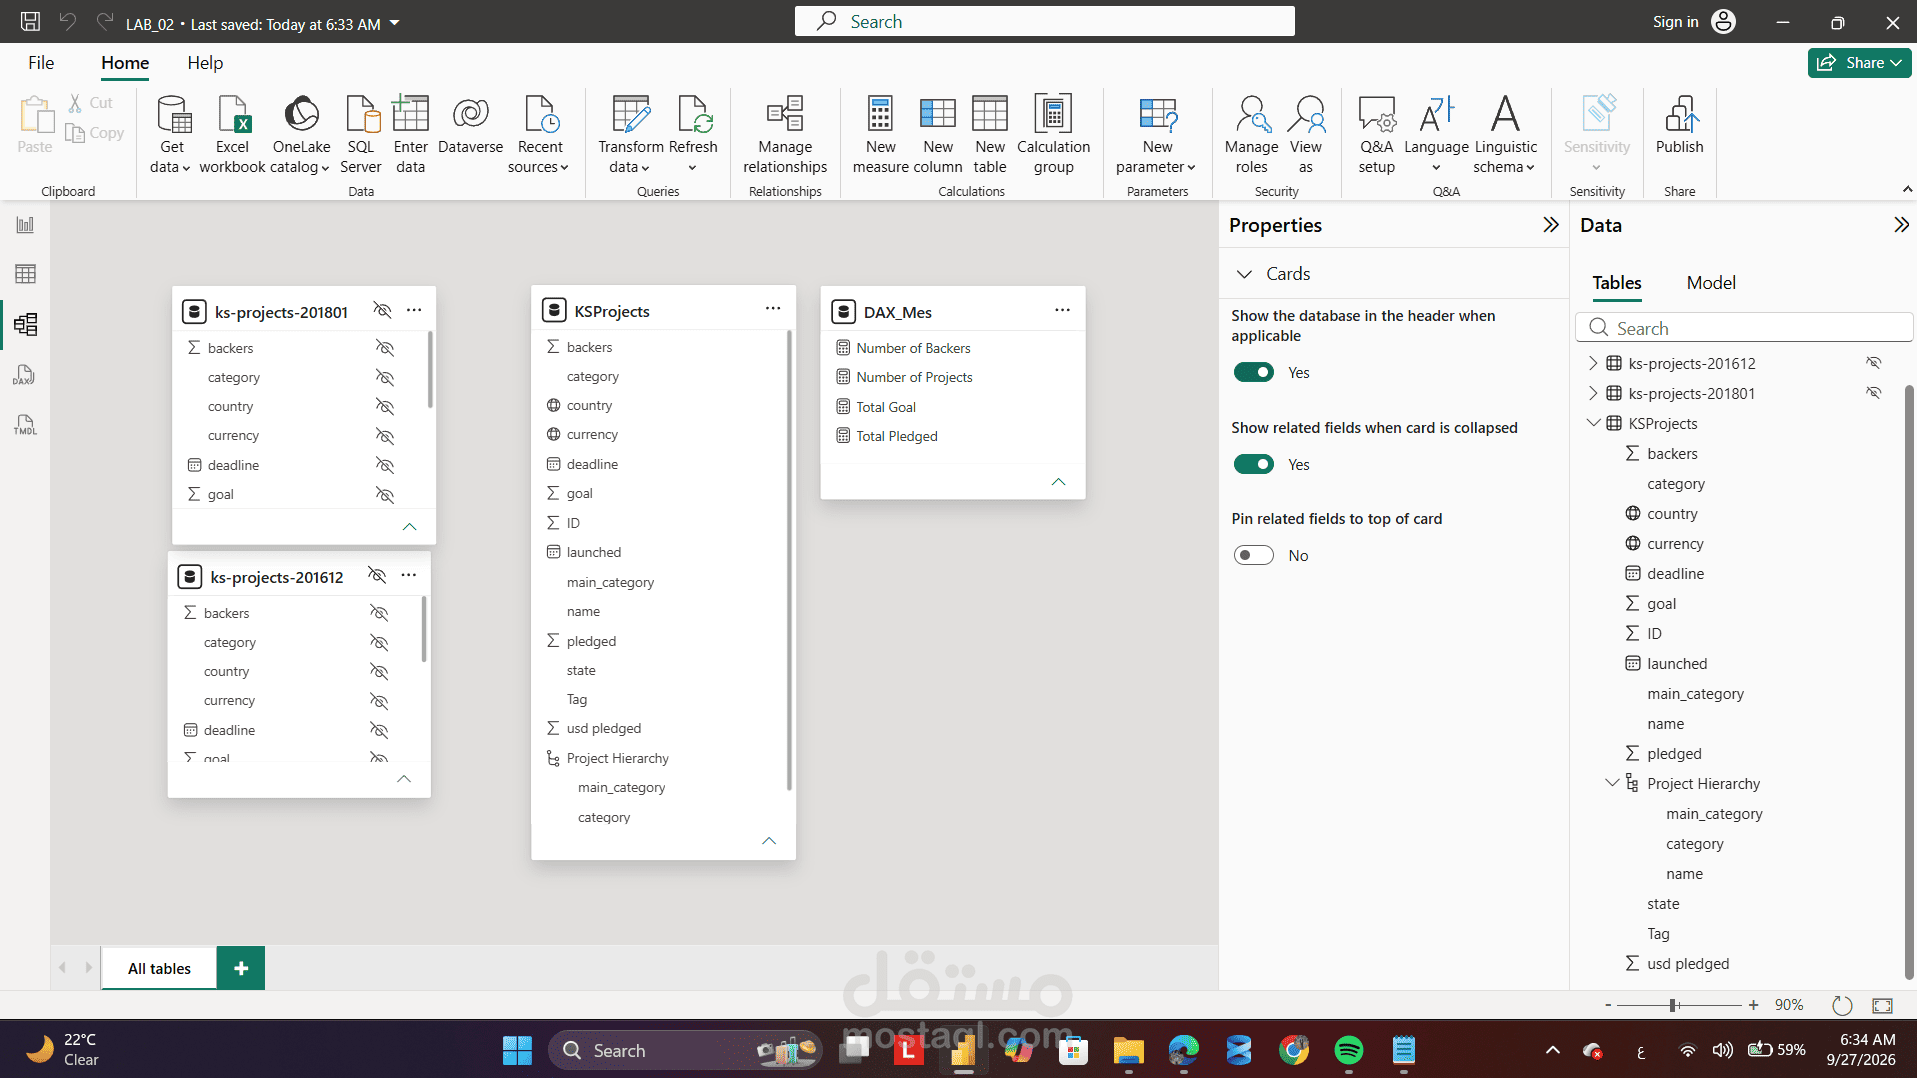
- Rename the table that has the whole data with clear name (ex: KS Projects, ks-projects, Projects, All Date) and remove or hide other table/tables based on the steps. "we can do this by modeling"
=> 2016, 2018
Result => 2016+2018, 2018
=> 2016 , 2018 + 2016
=> 2016 , 2018, 2016 + 2018
Modeling:
- Create Hierarchy (Main Category, Category and Project Name) Called it "Project Hierarchy"
- We can hide the unneeded tables or rename tables.
- Number of Projects Measure
- Number of Backers Measure
- Total Pledged Measure
- Total Goal Measure
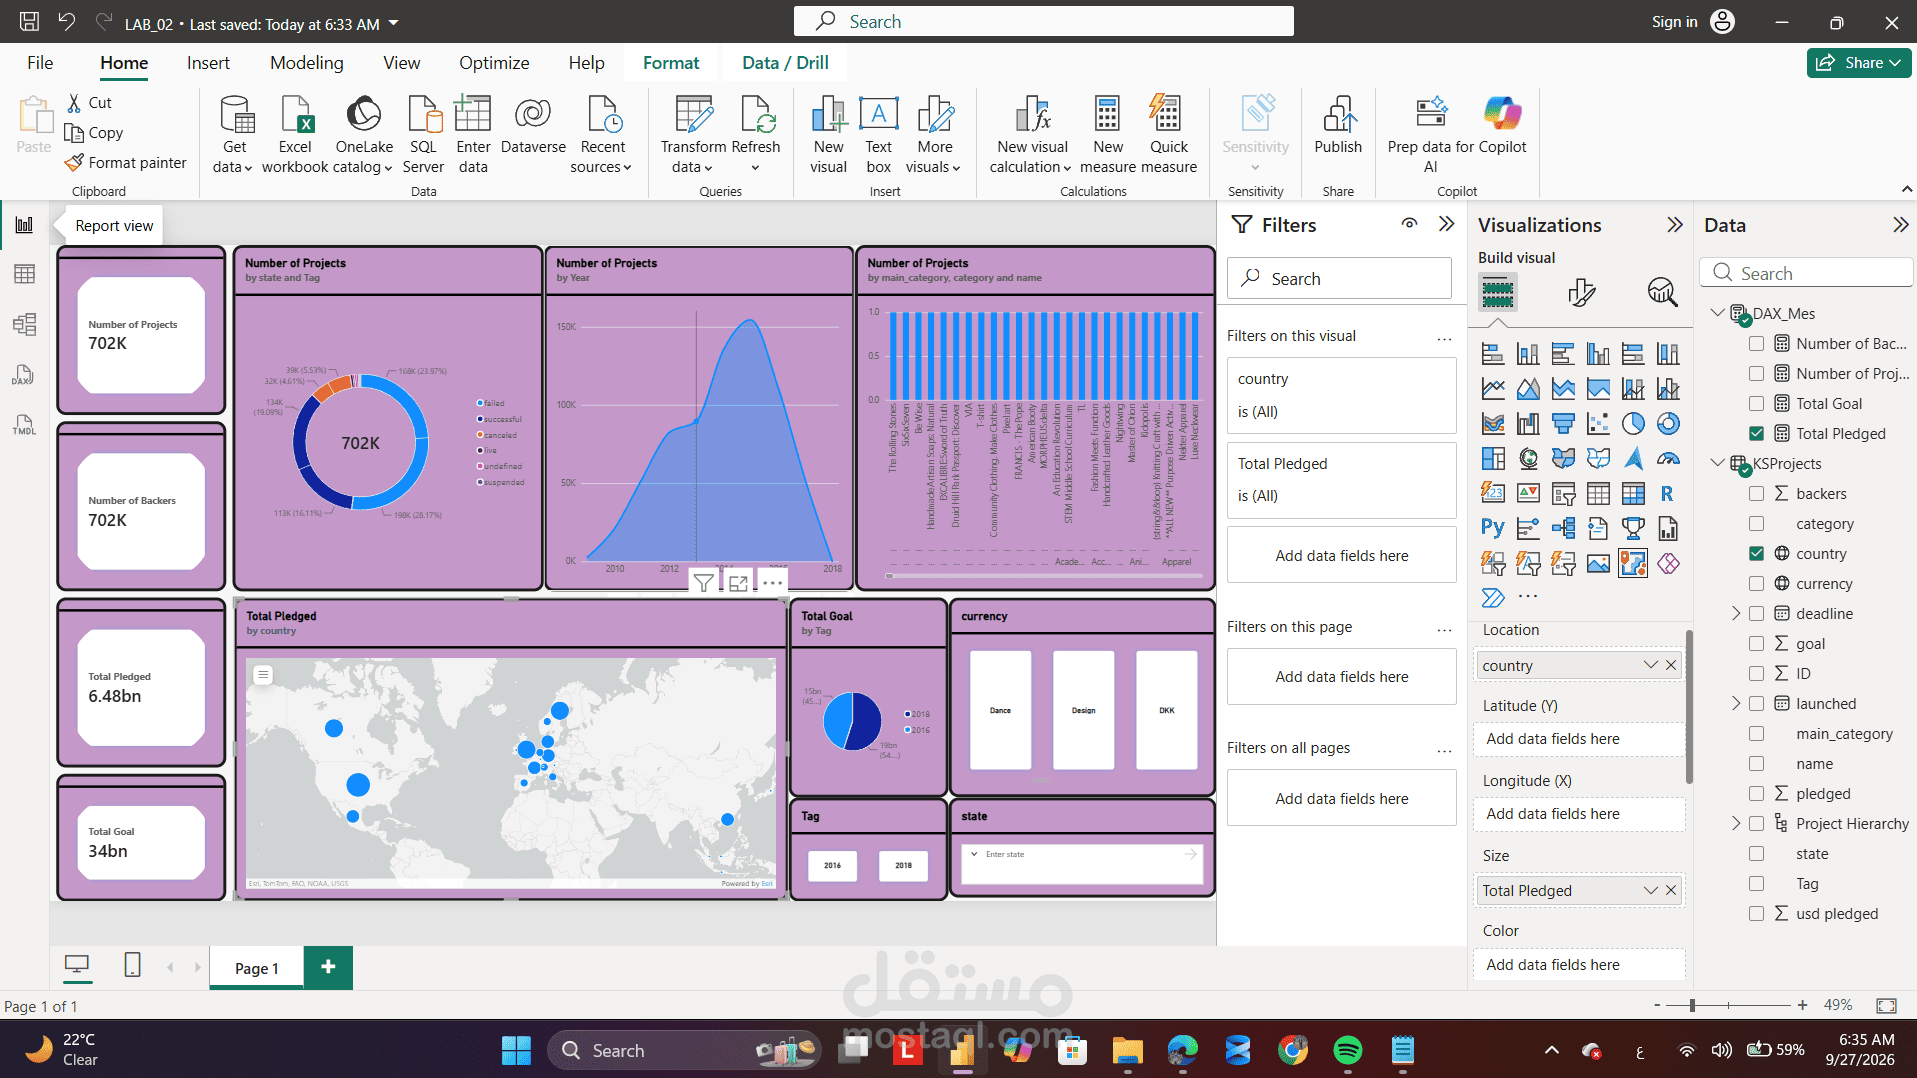
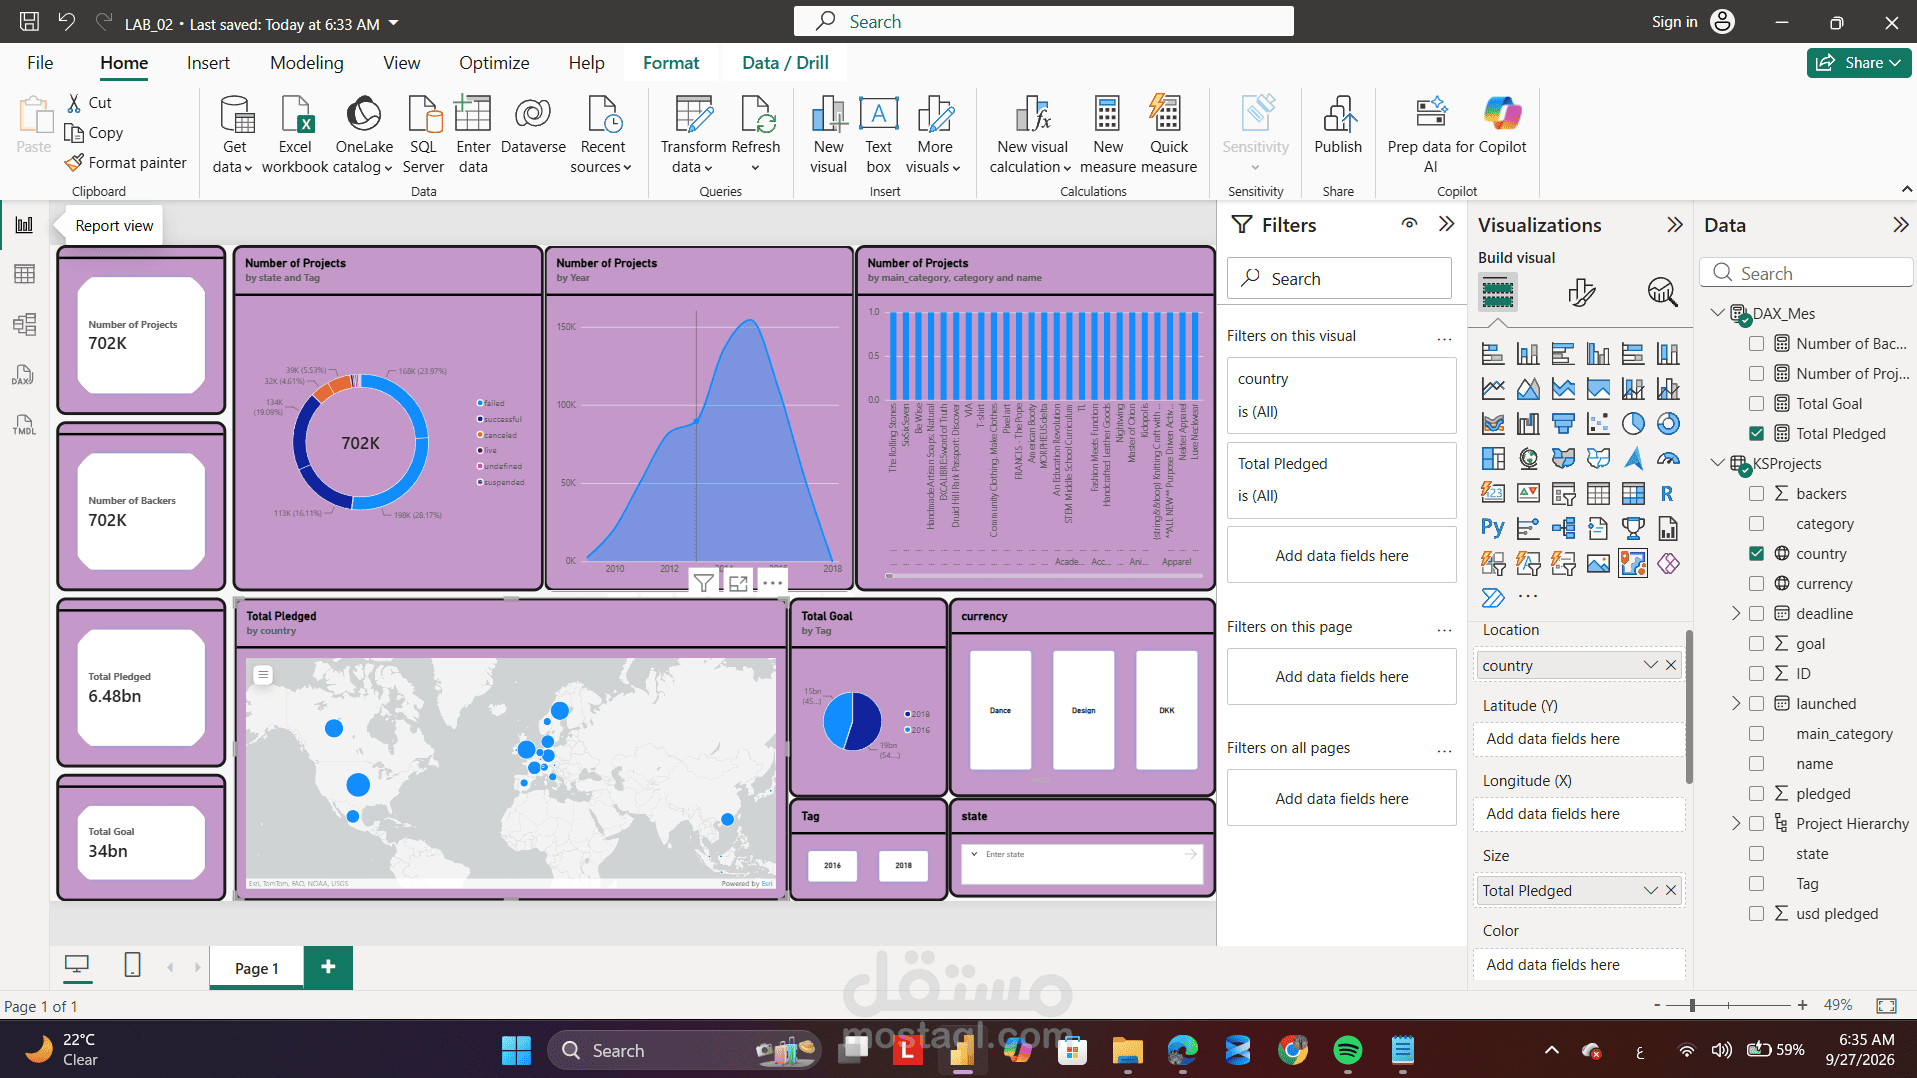
Visuals: (Use Measures)
- Number of Projects (# Projects) Card
- Number of Backers Card
- Total Pledged Card
- Total Goal Card
- # Projects by State
- # Projects by Project Hierarchy (Drill Down)
- # Projects by Launched
- Total Pledged by Currency or Country
-- Good Colors, Layout and Chart Titles (Meaningful)
Hints:
- Number of Projects = Count of Projects = # Projects