Retail Sales Data Cleaning and Business Analysis with Python
تفاصيل العمل
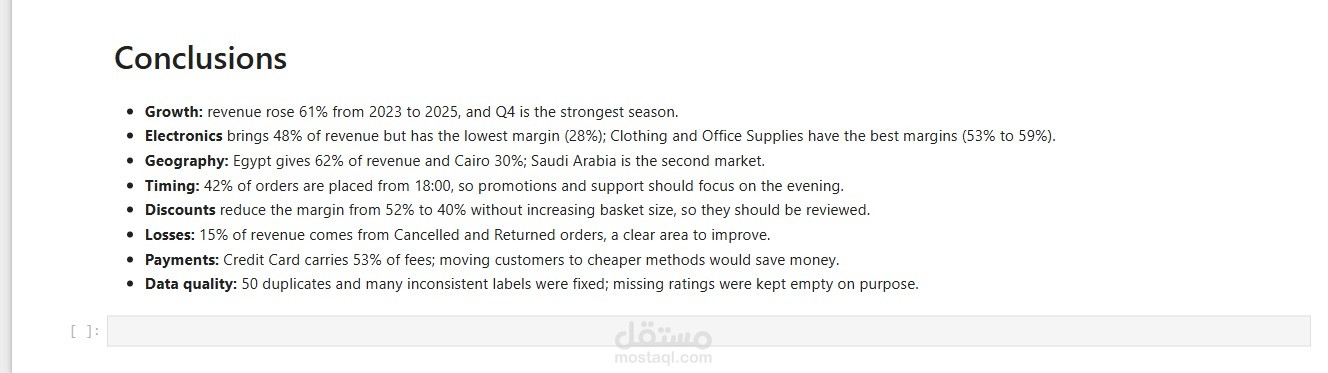
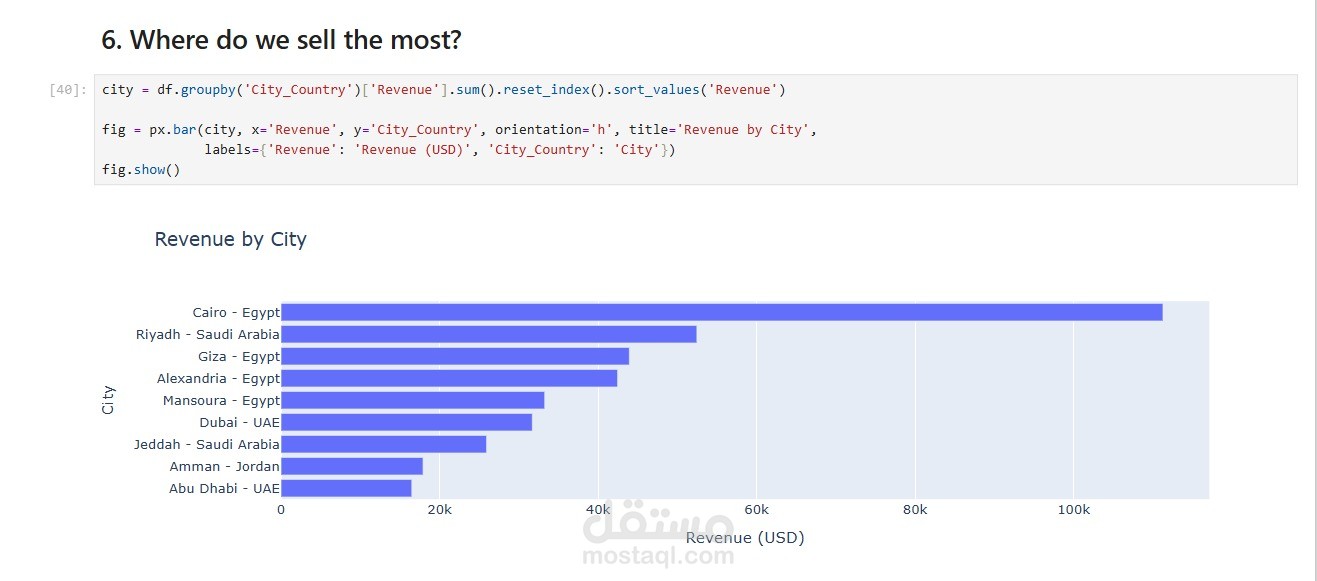
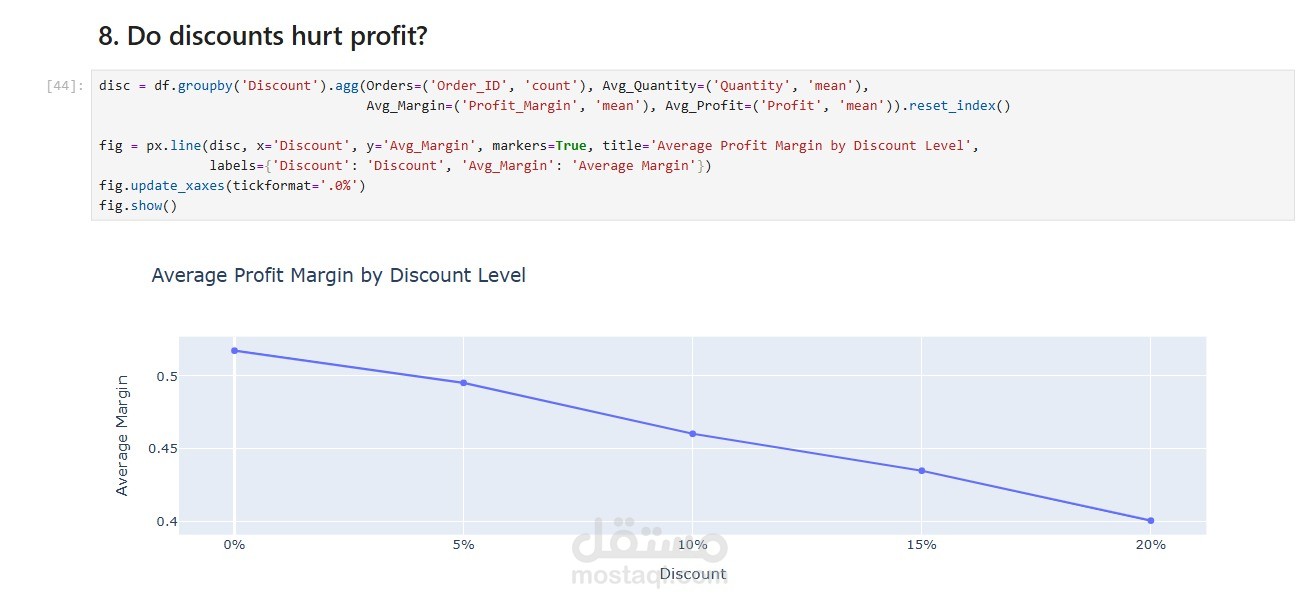
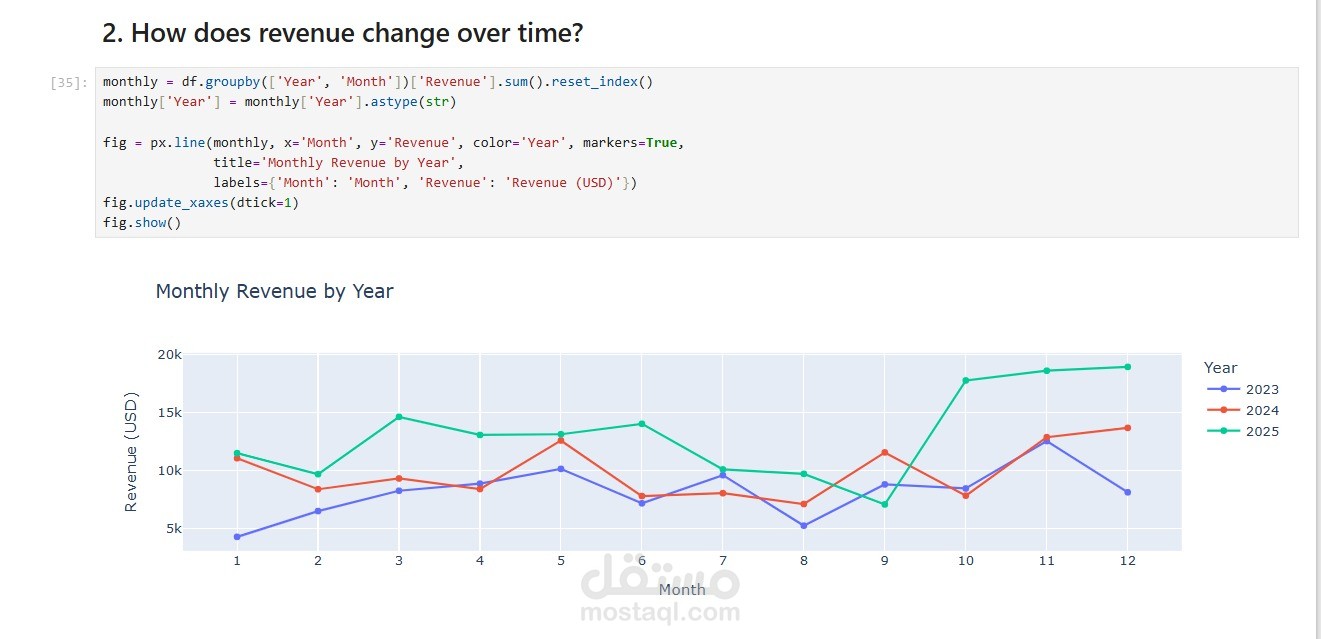
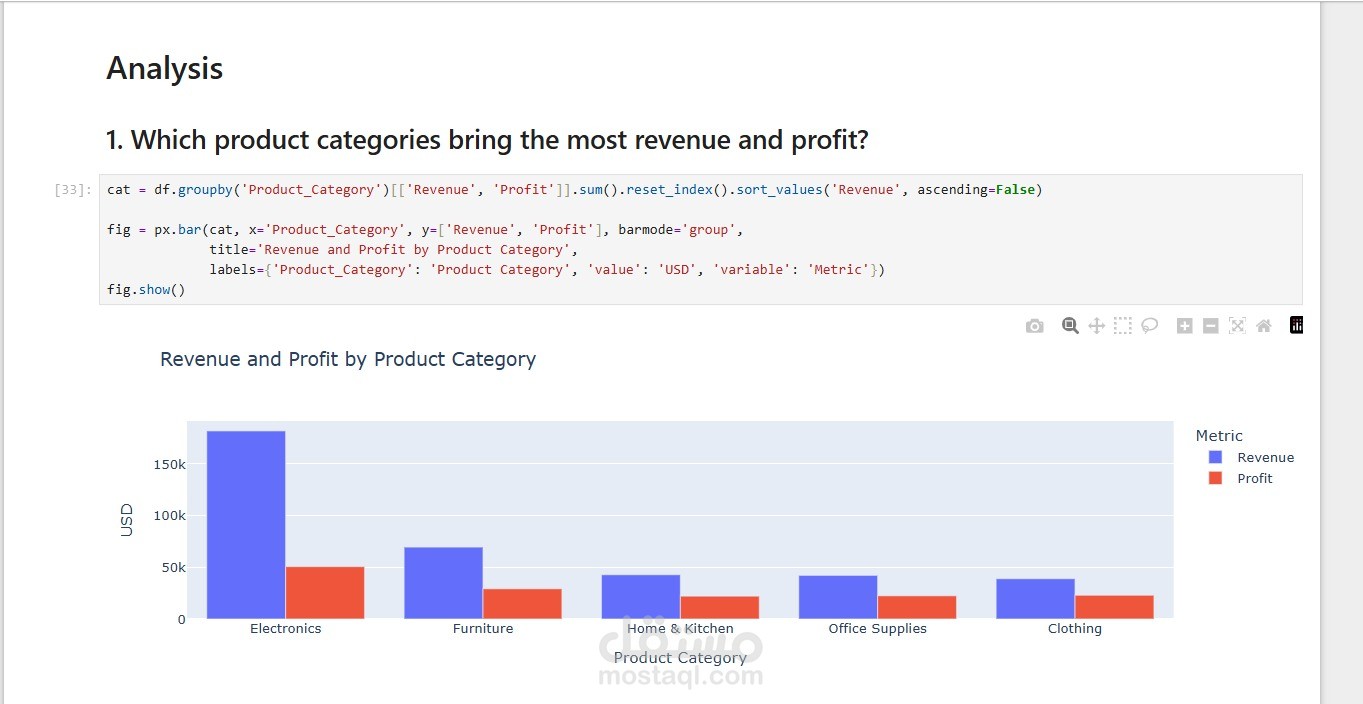
This project cleans and analyzes a retail sales dataset of 2,000 orders (2023-2025) using Python, Pandas, and Plotly.
Data cleaning:
- Removed 50 duplicate rows.
- Standardized customer names, gender values, product categories, and payment methods.
- Split Location into City and Country.
- Handled missing values (customer age and ratings) and checked outliers.
Feature engineering:
- Date features (year, month, weekday, hour), revenue, profit, payment fees, order size, and customer age groups.
Analysis (10+ business questions with charts):
- Revenue and profit by category and product.
- Monthly revenue trend, best sales reps, sales by city and country.
- Order timing, discount impact, cancelled/returned orders, payment fees, and customer ratings.
- Correlation heatmap between numeric features.
Deliverable: a documented Jupyter Notebook with cleaning steps, interactive charts, and written conclusions.