Cafe Sales Data Cleaning and Visualization with Python
تفاصيل العمل
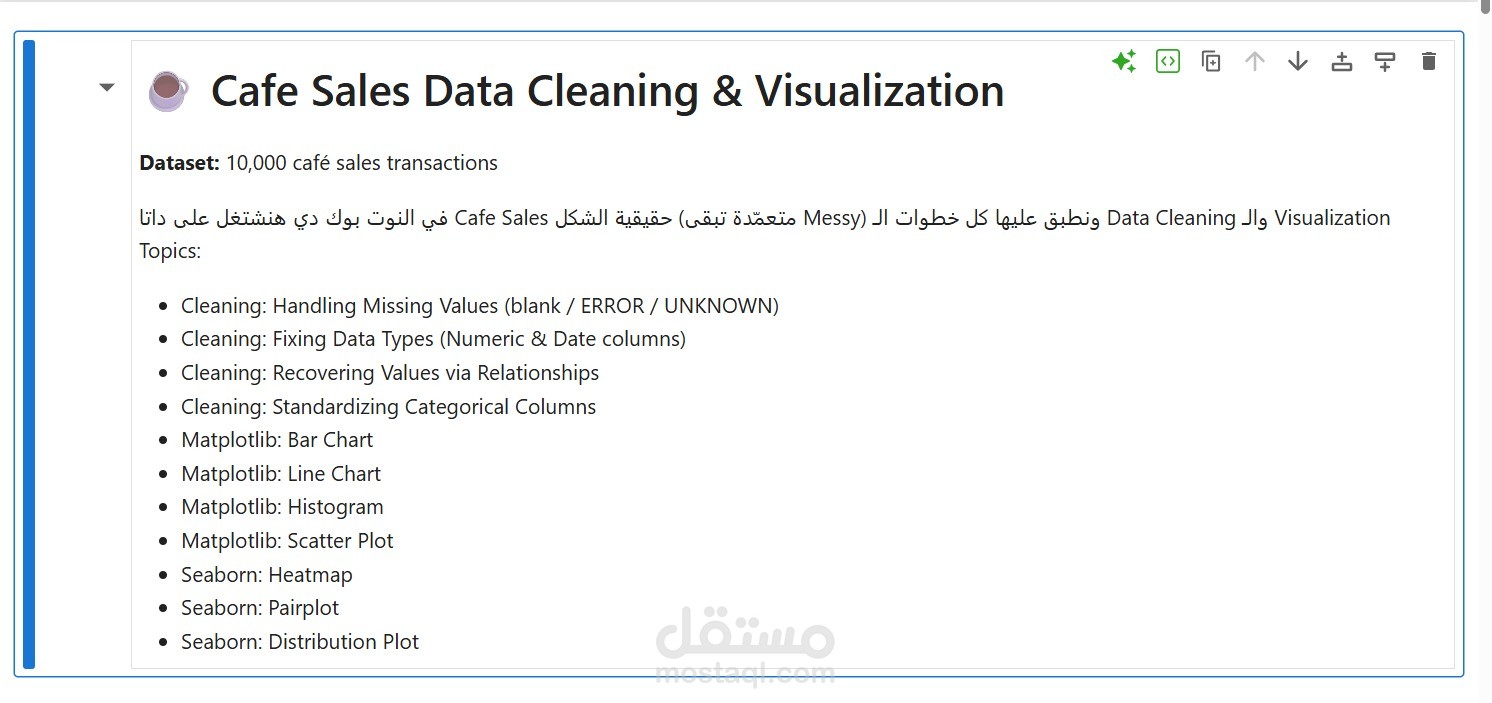
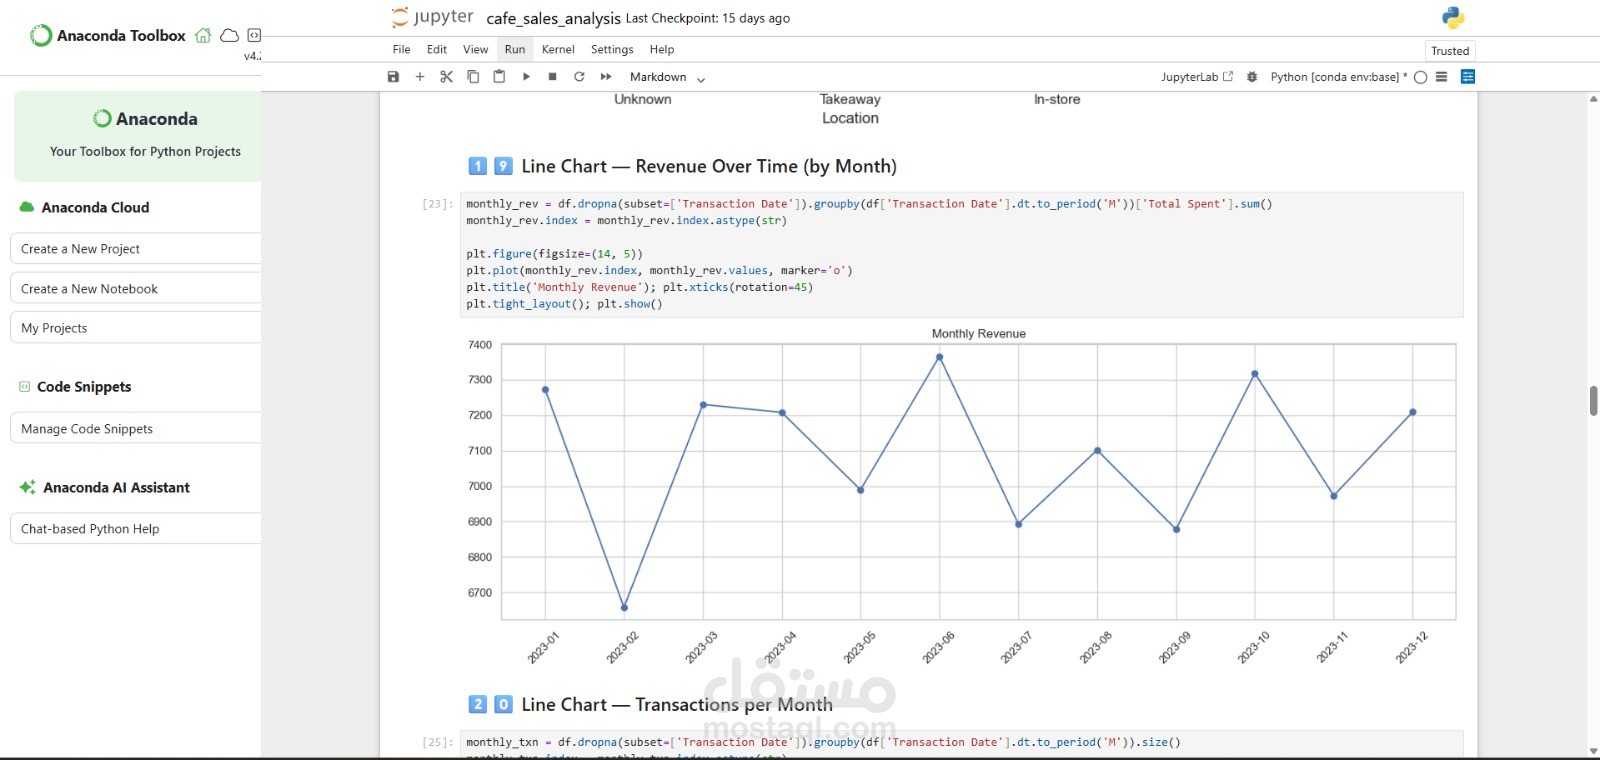
This project cleans and analyzes a messy dataset of 10,000 café sales transactions using Python and Pandas.
What I did:
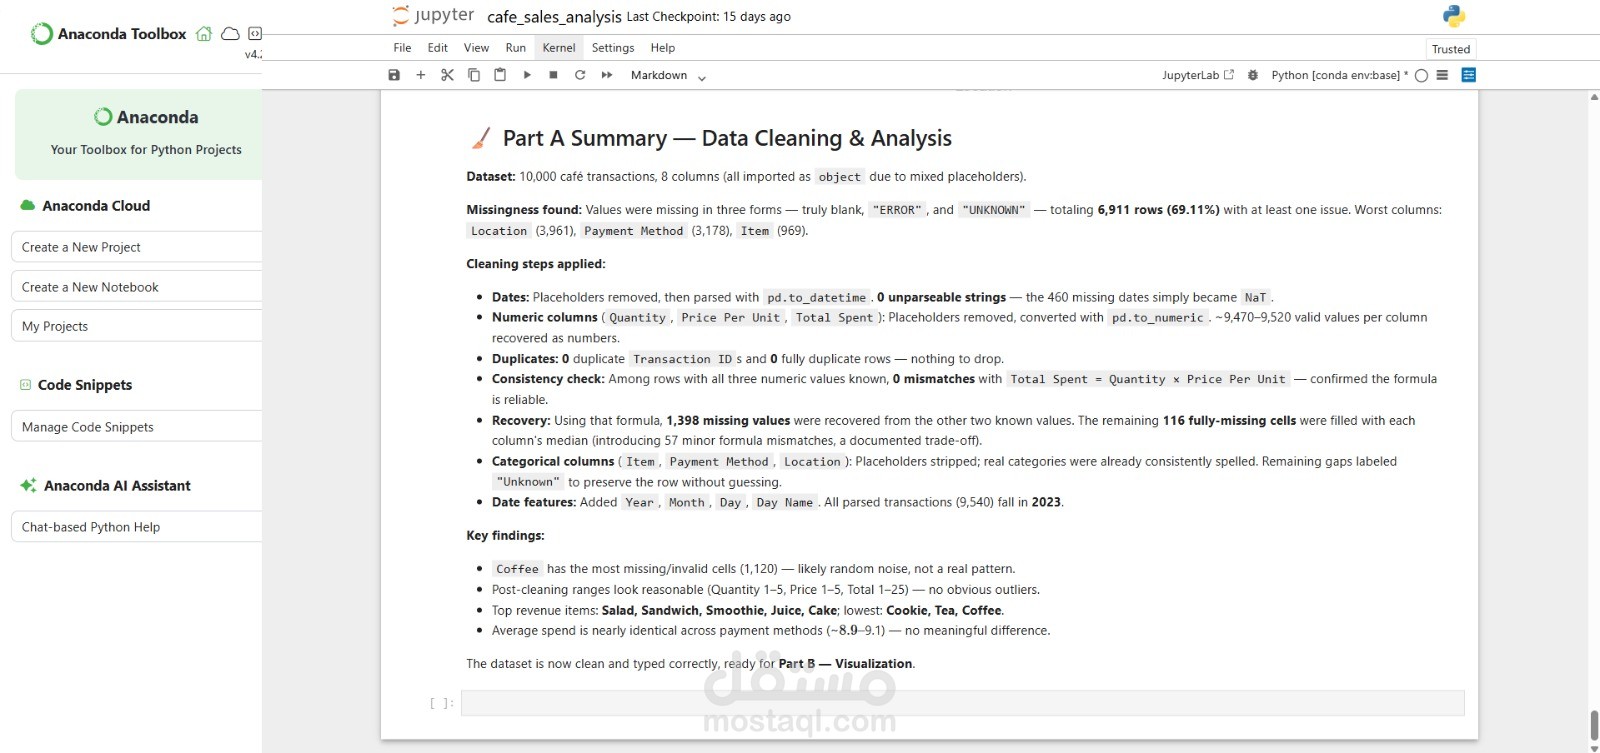
- Found missing data in three forms (blank, "ERROR", "UNKNOWN"): 69% of rows had at least one issue.
- Converted date and numeric columns to the correct data types.
- Checked for duplicates (none found) and confirmed that Total Spent = Quantity x Price Per Unit.
- Recovered 1,398 missing values using this relationship.
- Standardized categorical columns and labeled remaining gaps as "Unknown".
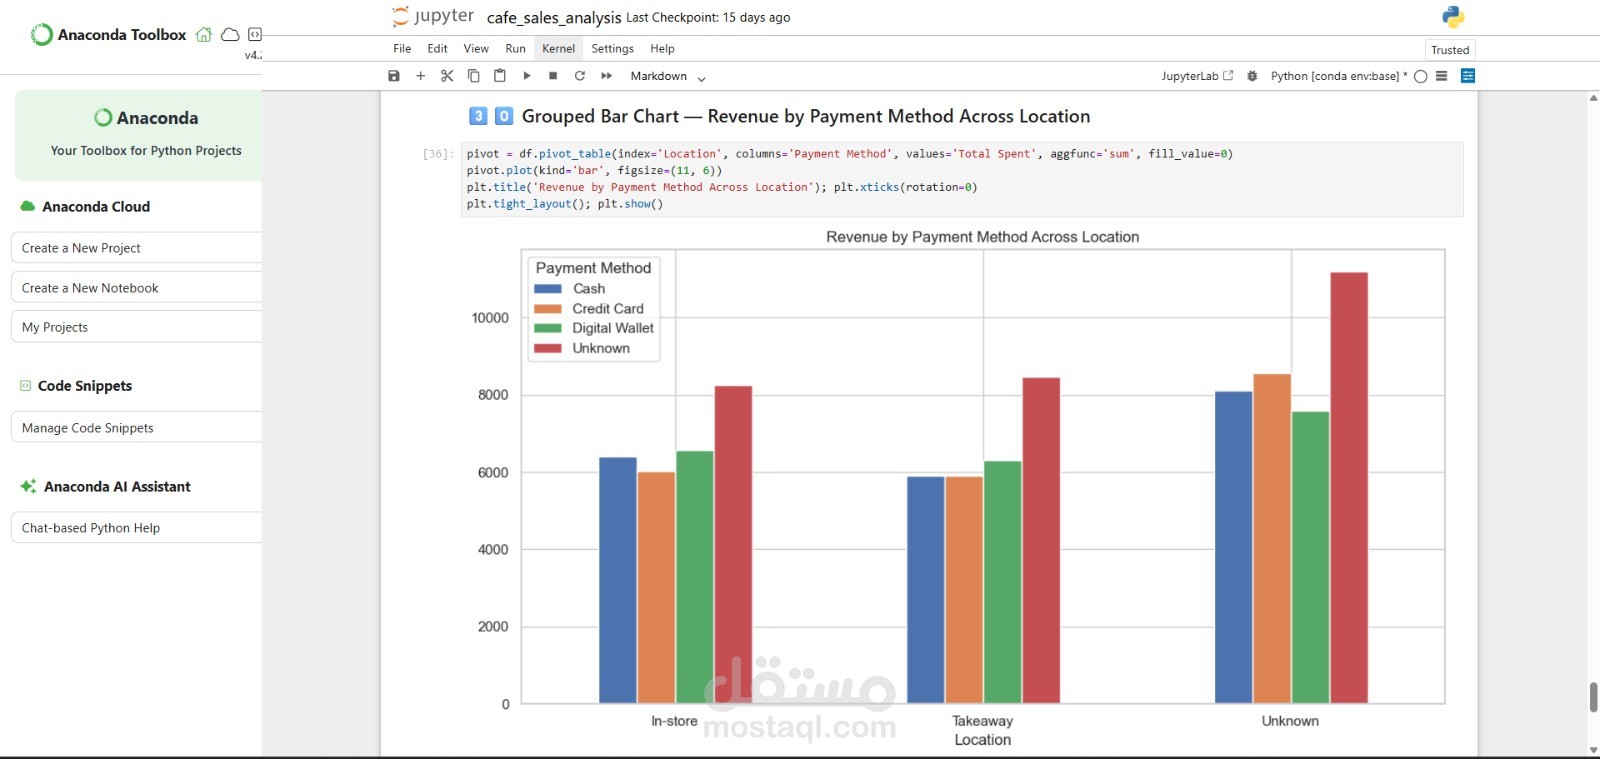
- Analyzed revenue by item, payment method, location, and month.
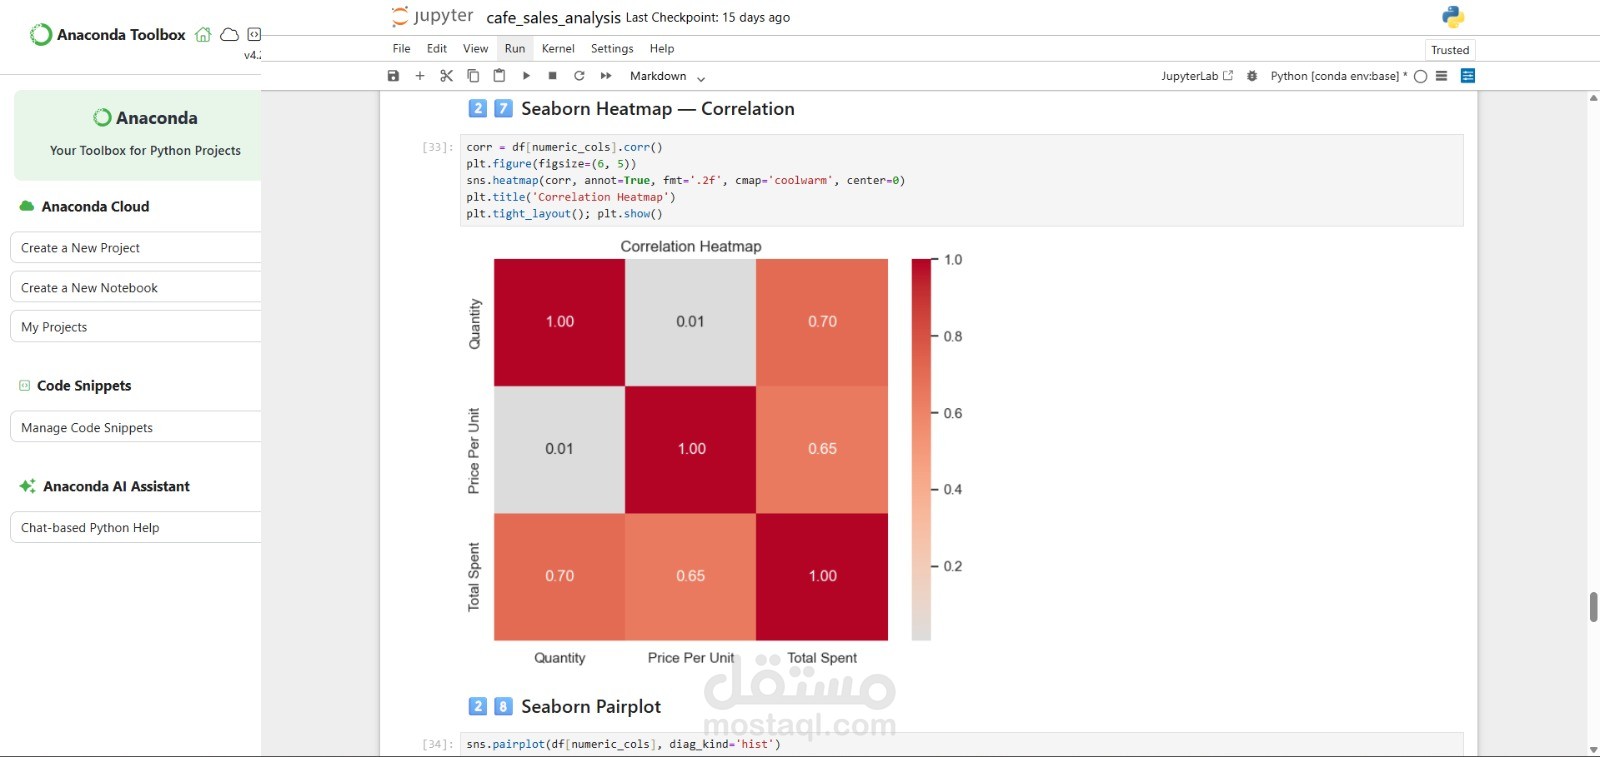
- Created charts with Matplotlib and Seaborn: bar charts, line charts, histograms, scatter plots, a heatmap, and a pairplot.
Deliverable: a documented Jupyter Notebook with the cleaning steps, charts, and a summary of findings.