Global Development Explorer: An Interactive Gapminder Dashboard
تفاصيل العمل
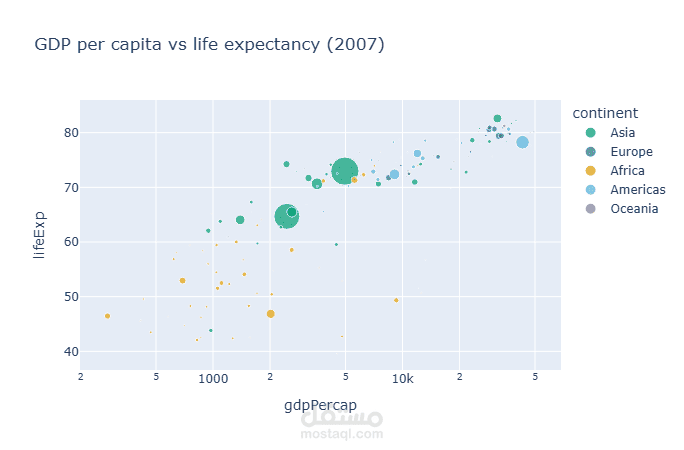
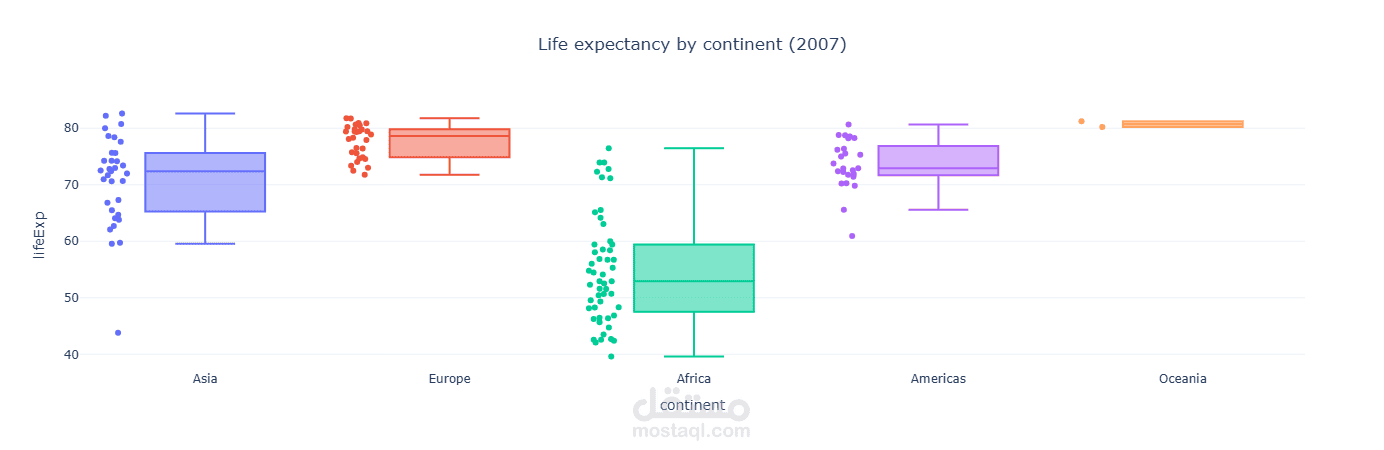
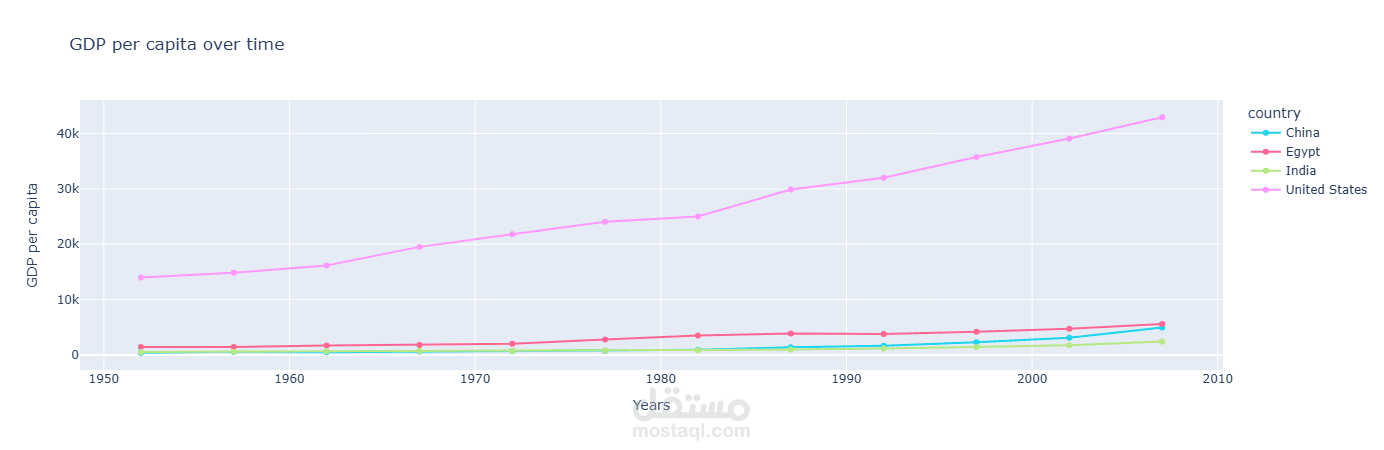
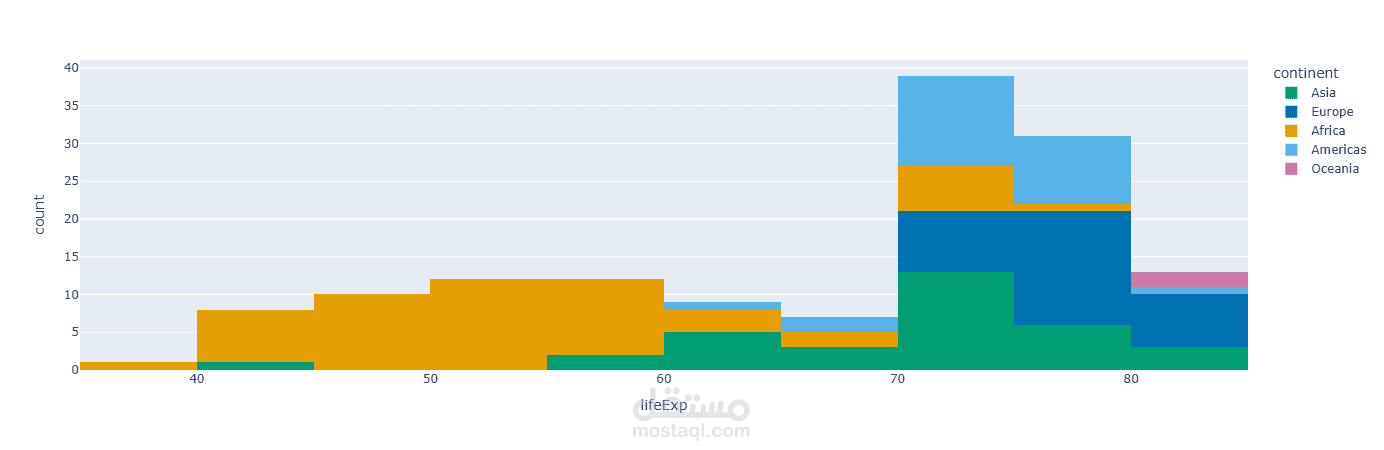
An interactive web dashboard built with Python, Plotly and Dash that explores global development using the Gapminder dataset. It combines KPI cards, a world map, a GDP vs life expectancy scatter plot, a population bar chart and a life expectancy histogram, plus interactive controls (country dropdown, metric selector, year slider) that update the charts in real time through callbacks.