Uber Ride Data Analysis Dashboard Using Power BI
تفاصيل العمل
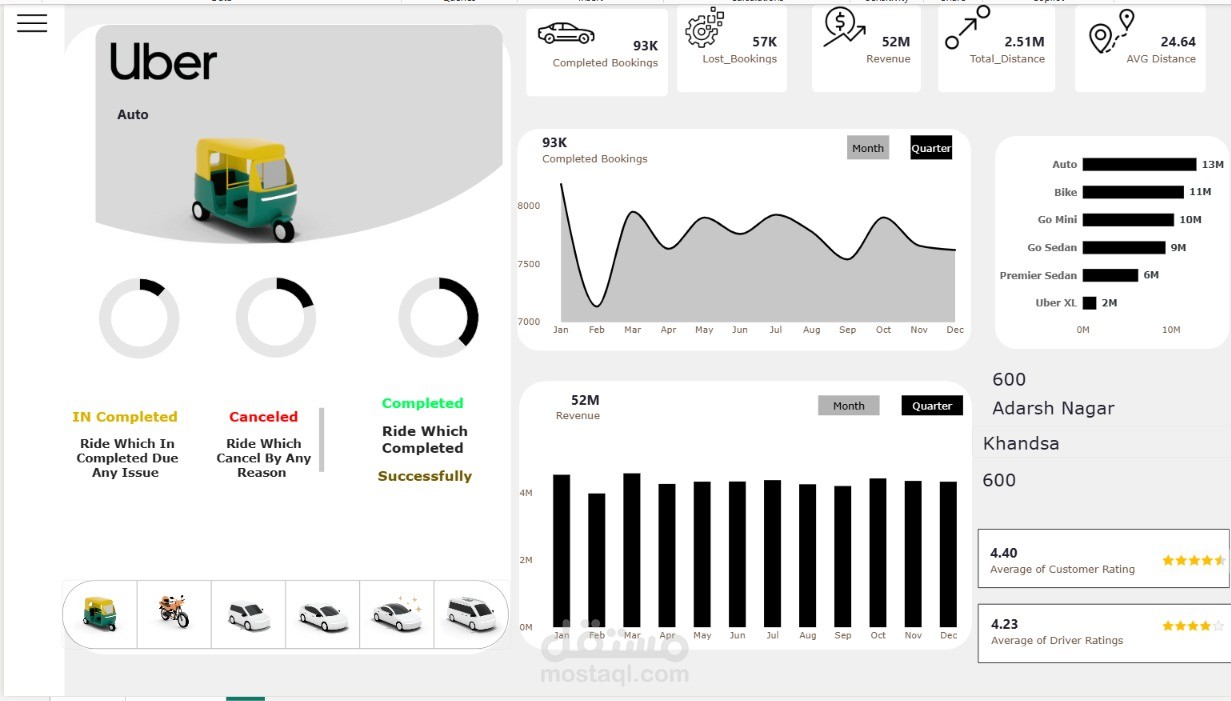
Uber Ride Analytics Dashboard | Power BI
This project focuses on analyzing Uber ride data using Microsoft Power BI to identify trip patterns, understand demand trends, and generate useful business insights.
Key Features:
Prepared and transformed ride data using Power Query.
Analyzed ride demand across different time periods.
Created visualizations to explore trip patterns and trends.
Developed KPIs to monitor ride activity.
Designed an interactive dashboard to present key findings.
Tools Used: Microsoft Power BI, Power Query, DAX, and Data Visualization.
Project Goal: To transform ride data into meaningful insights that support data-driven decisions.