Sales Performance Dashboard Using Power BI
تفاصيل العمل
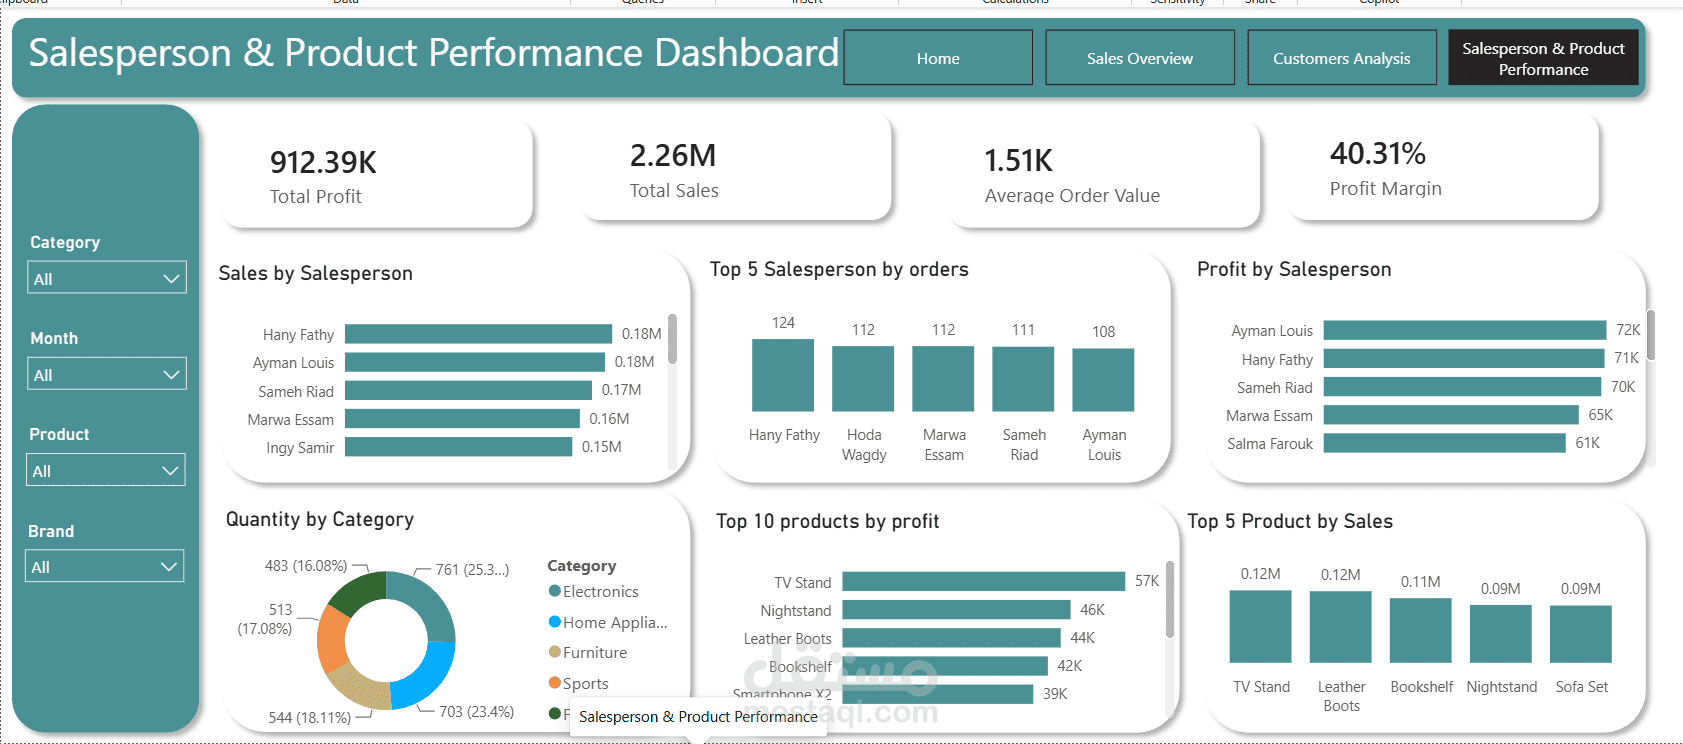
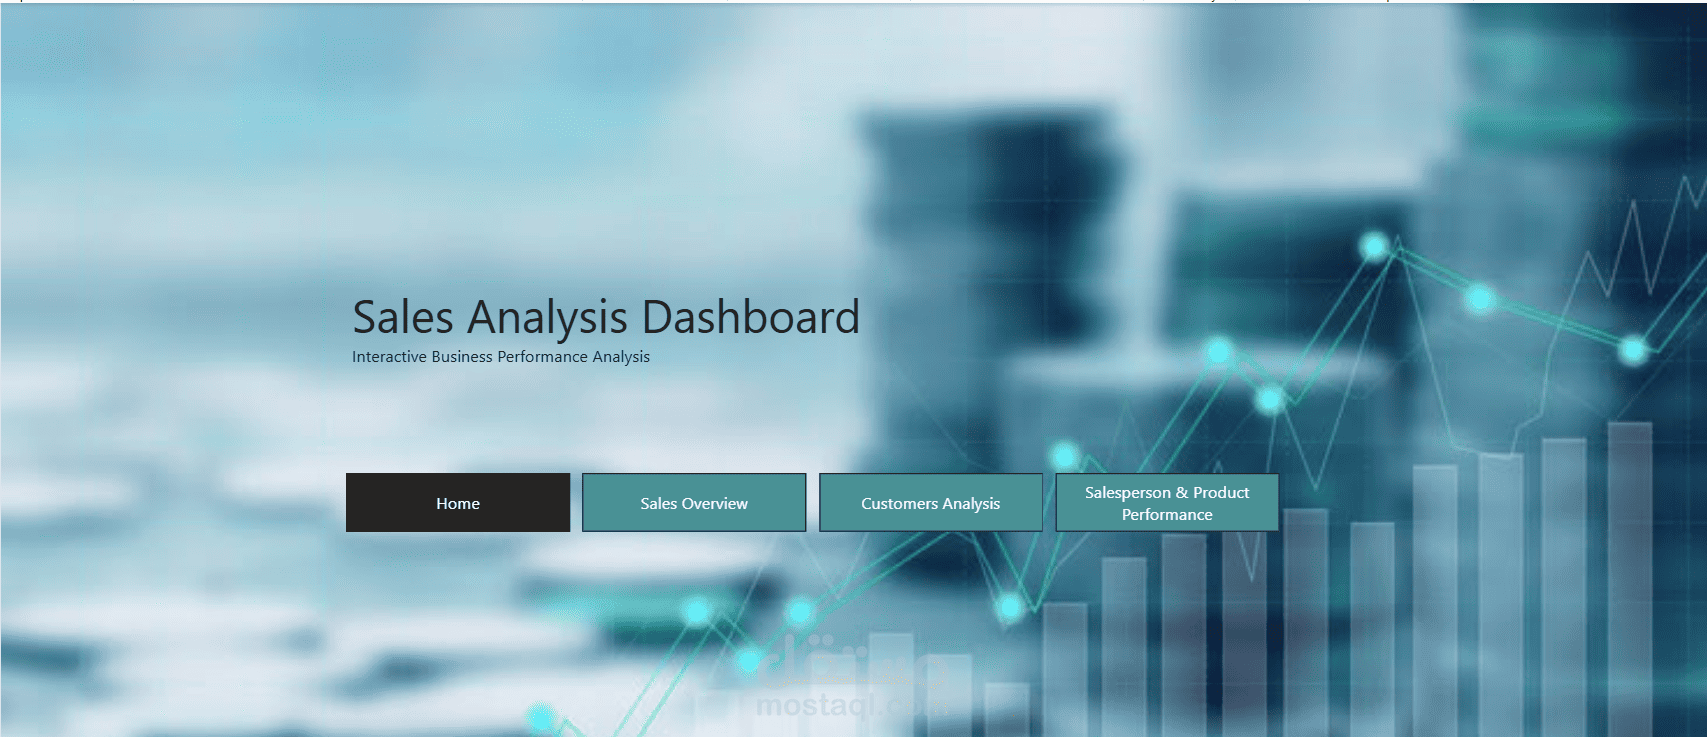
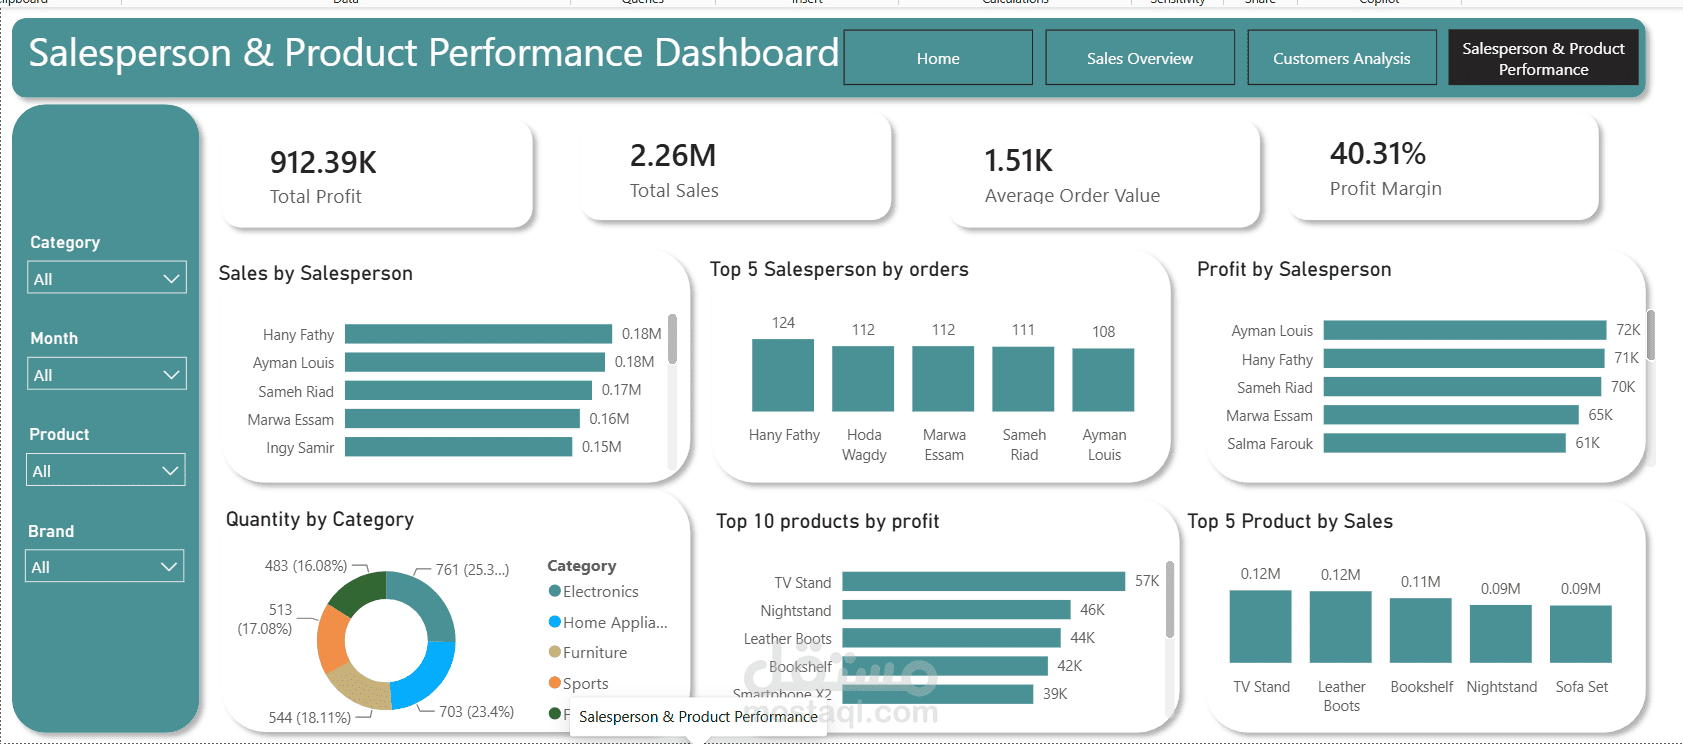
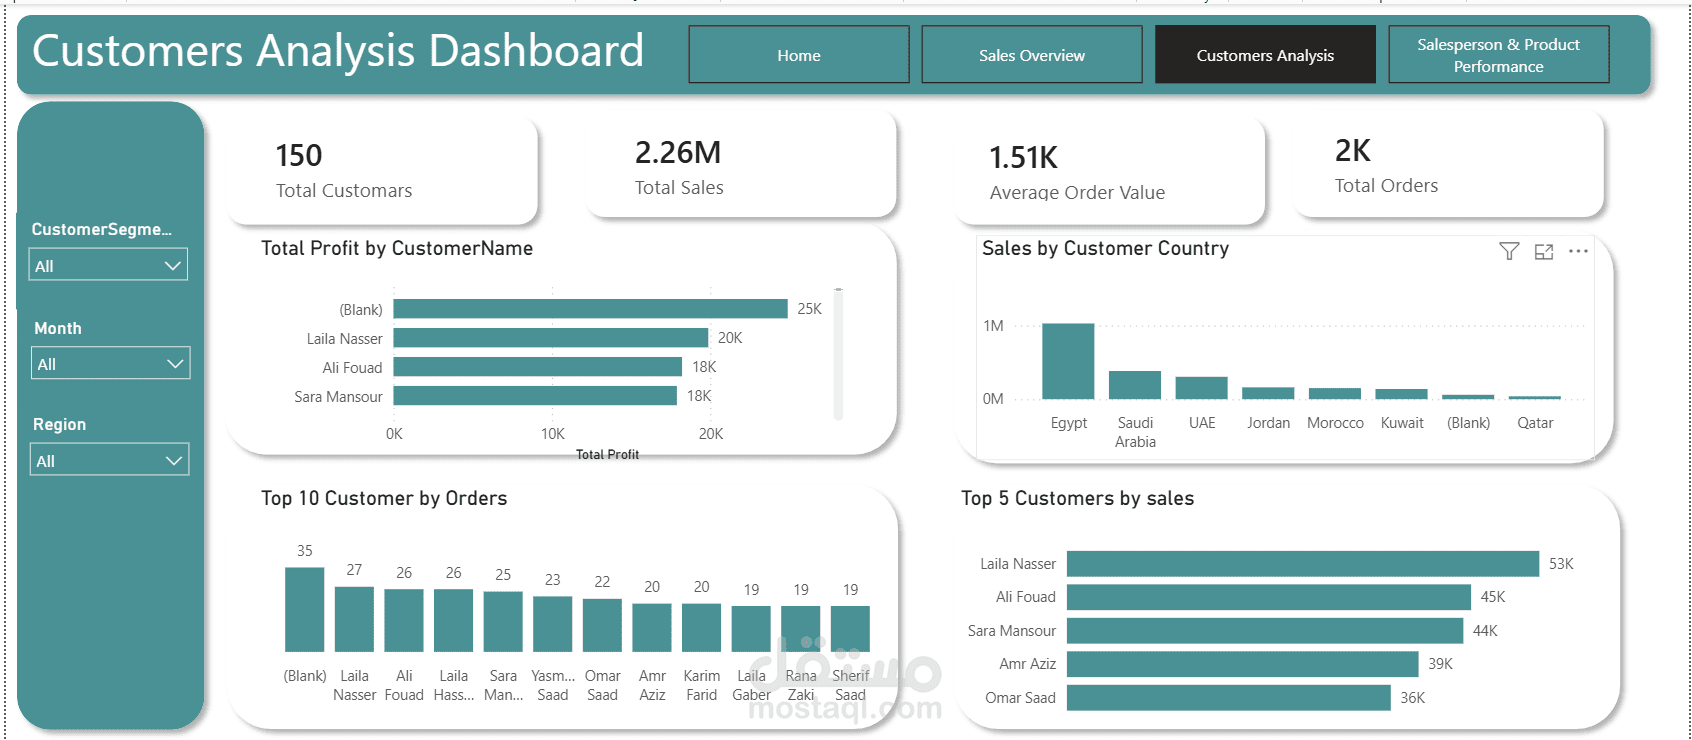
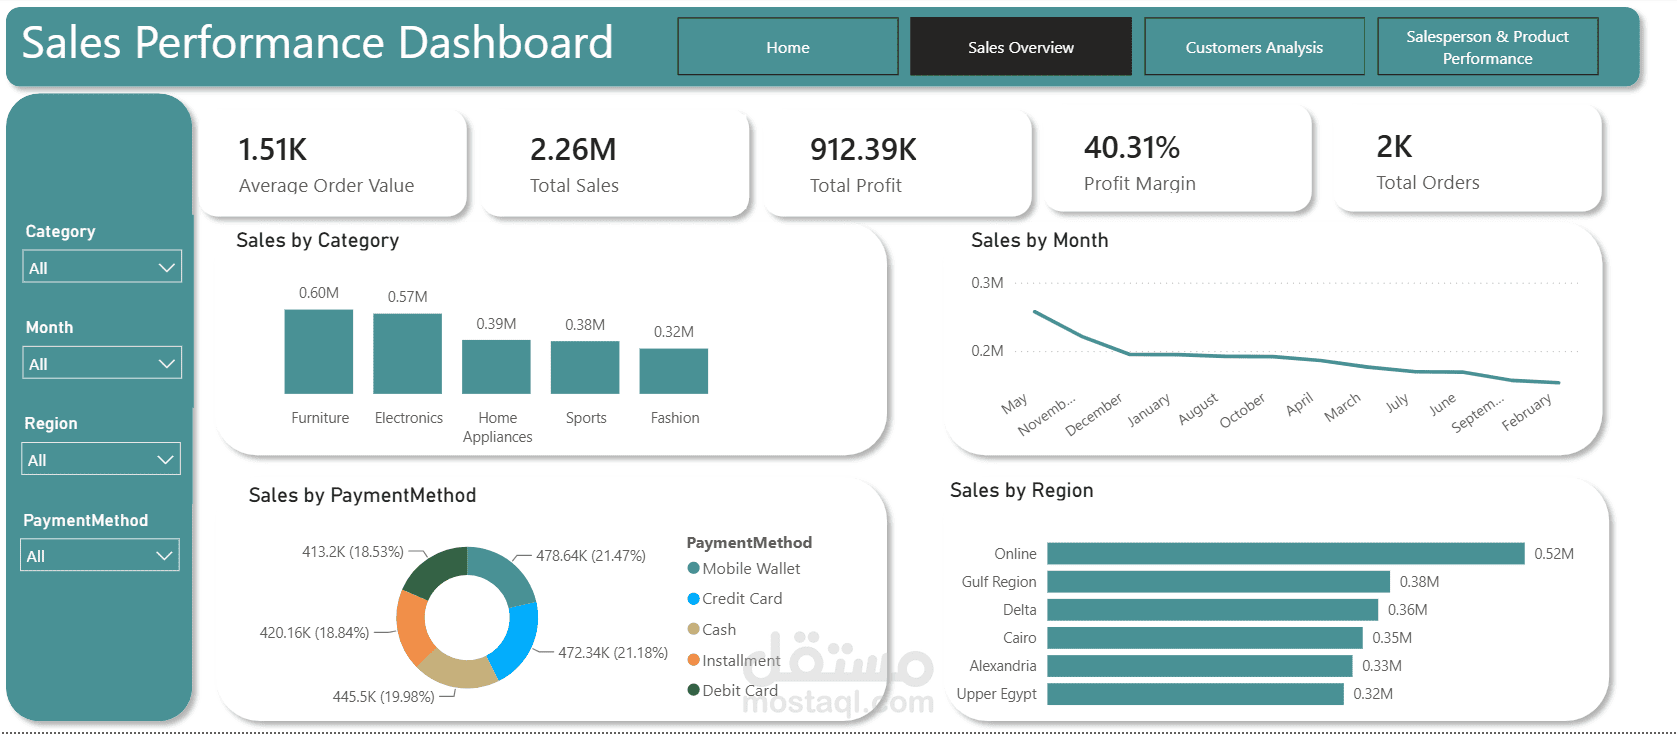
Developed an interactive Sales Performance Dashboard using Power BI to analyze sales data and evaluate business performance using the Superstore dataset.
**Project Features:**
- KPI cards for Total Sales, Total Profit, Total Orders, and Profit Margin.
- Sales trend analysis over time.
- Sales analysis by category, region, and customer segment.
- Top 5 products analysis.
- Interactive slicers for Year, Region, Category, and Segment.
- Data cleaning, organization, and visualization to support data-driven decision-making.
**Tools Used:** Microsoft Excel, Pivot Tables, Pivot Charts, Data Visualization, and Interactive Dashboards.
This project demonstrates my ability to transform raw sales data into meaningful insights through clear and interactive visualizations.