Sales Performance
تفاصيل العمل
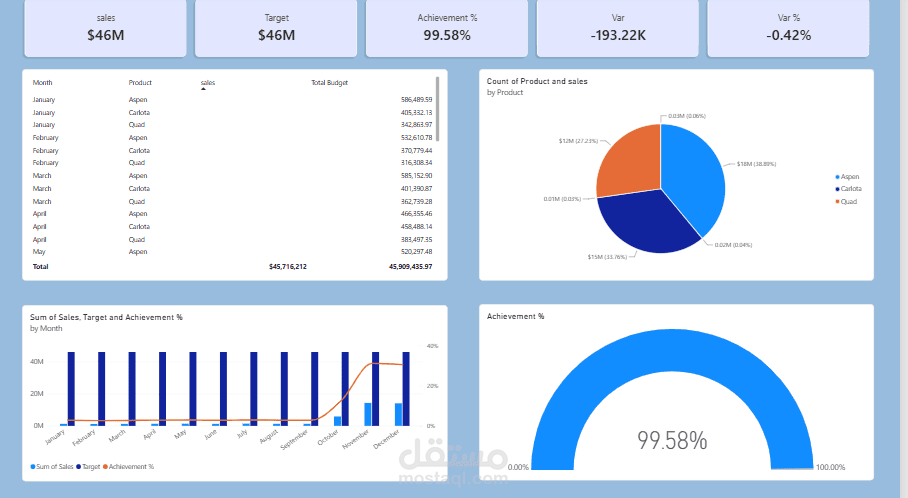
# Sales Performance Analysis Dashboard – Power BI
### Project Overview
This project focuses on analyzing sales performance against targets using Microsoft Power BI. The dashboard provides an overview of sales, budget targets, achievement rates, and performance variances through interactive visualizations.
### Tools Used
* Microsoft Power BI
* Power Query
* DAX
### Key Features
* **KPI Cards:** Display total sales, target, achievement percentage, and sales variance.
* **Sales vs. Target Analysis:** Compare actual sales with budget targets across different months.
* **Product Performance:** Analyze sales distribution across products, including Apen, Carlotta, and Quad.
* **Achievement Tracking:** Visualize the overall target achievement rate using a gauge chart.
* **Monthly Performance:** Monitor sales trends and identify differences between actual results and planned targets.
### Key Insights
* Total sales reached approximately **$46 million**.
* Overall target achievement was **99.58%**.
* Sales were approximately **$193.22K below the target**, representing a variance of **-0.42%**.
* The dashboard provides a clear comparison between actual sales and budget targets throughout the year.
### Project Outcome
Developed an interactive Power BI dashboard to monitor sales performance, track target achievement, and identify performance gaps, supporting data-driven business decisions.